复刻知乎网友的分析,终点还是熟悉过程,练习MySQL和Tableau
]]>复刻知乎网友的分析,终点还是熟悉过程,练习MySQL和Tableau
1 分析目的
- 了解母婴行业的发展趋势
- 分析找到重点客户
- 把握母婴产品主要使用对象
- 分析各类商品特征
- 找到受欢迎的母婴产品
2 理解数据
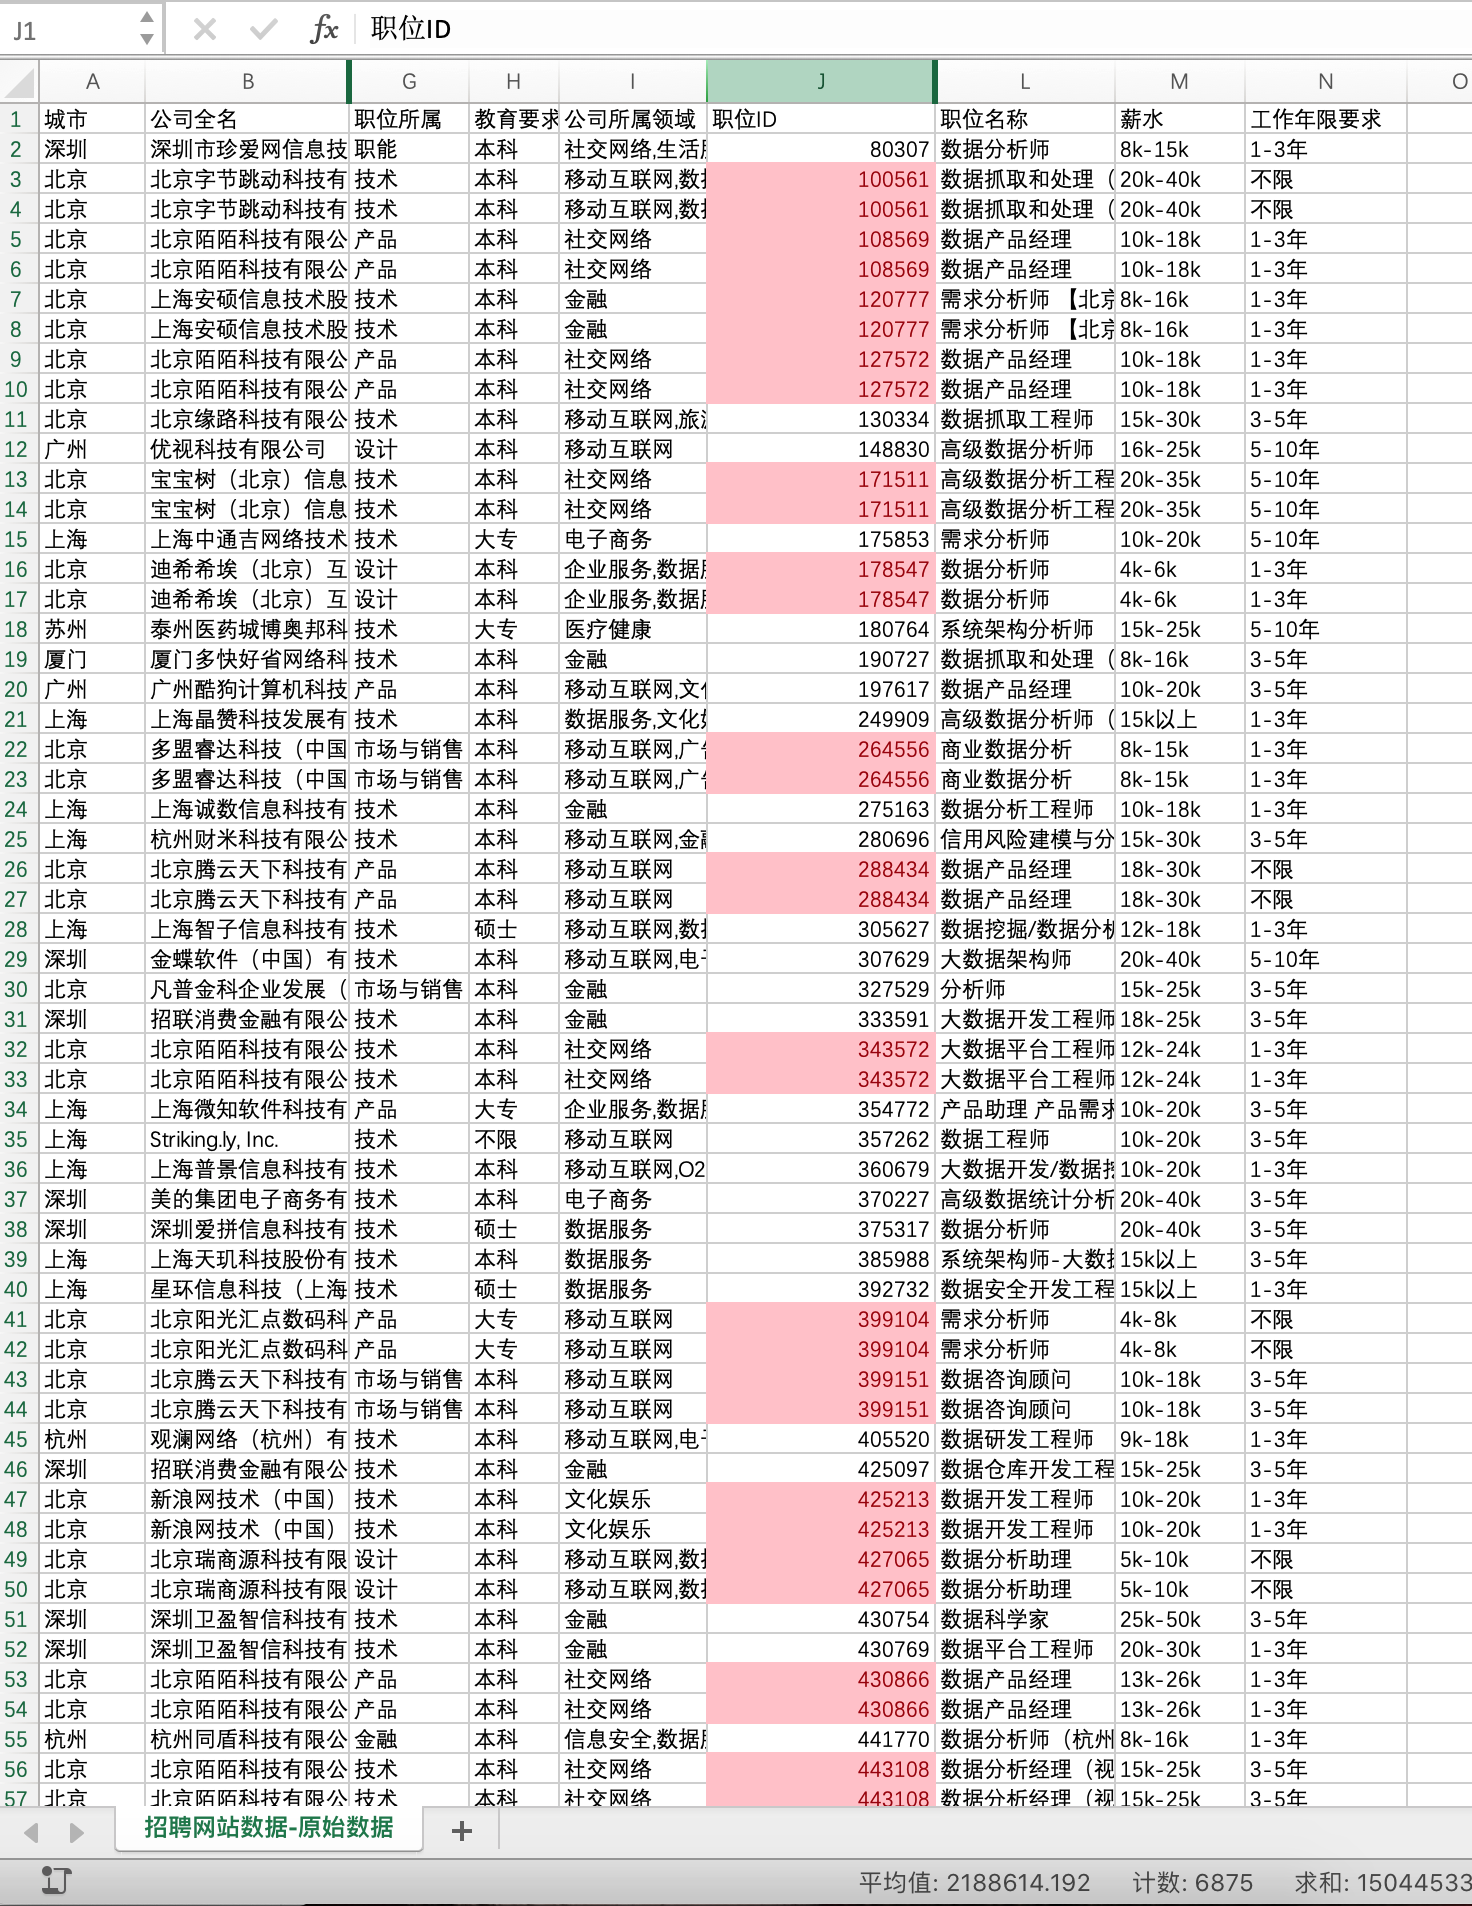
数据来自淘宝和天猫上购买母婴商品,时间段为2012年7月2日——2015年2月5日
包含两个数据集,
tianchi_mum_baby.csv 包含客户孩子的生日和性别
| Column | user_id | birthday | gender |
|---|---|---|---|
| 描述 | 客户ID | 生日 | 性别 |
tianchi_mum_baby_trade_history.csv 包含历史交易记录
| Column | user_id | auction_id | cat_id | cat1 | property | buy_mount | day |
|---|---|---|---|---|---|---|---|
| 描述 | 客户ID | 商品ID | 商品子类ID | 商品大类ID | 商品属性 | 购买数量 | 交易时间 |
3 数据清洗
由于 property 列是对商品属性的描述,对后续分析几乎无作用,所以将其剔除。
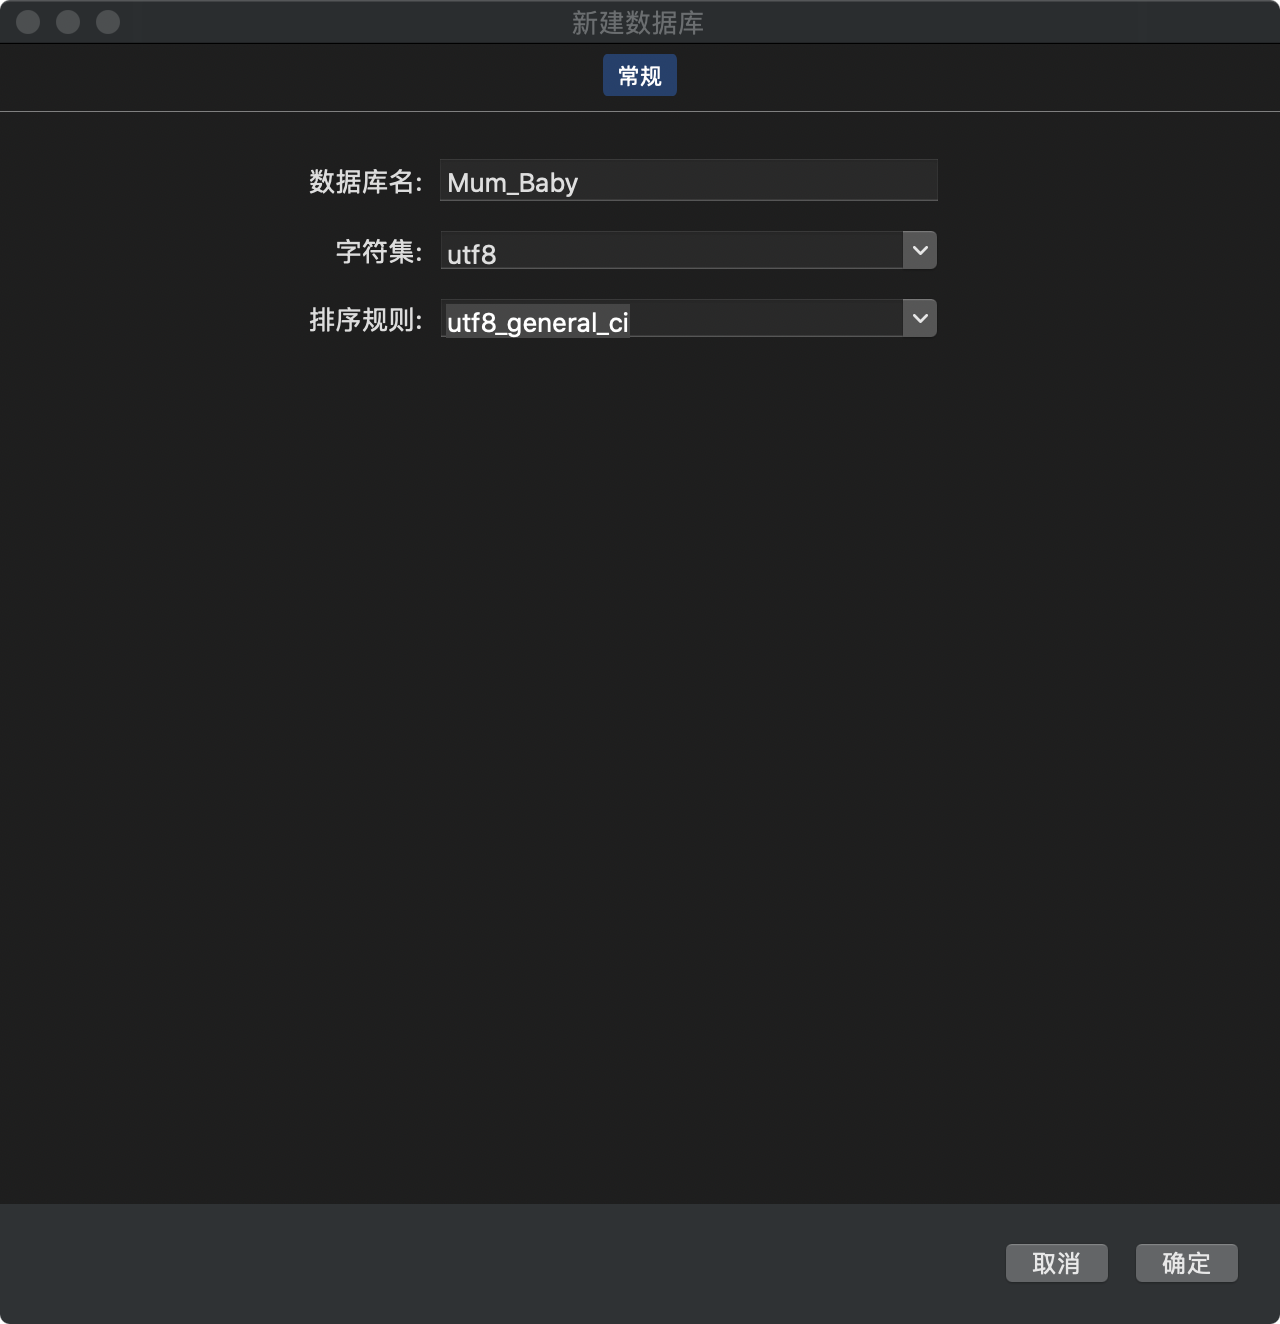
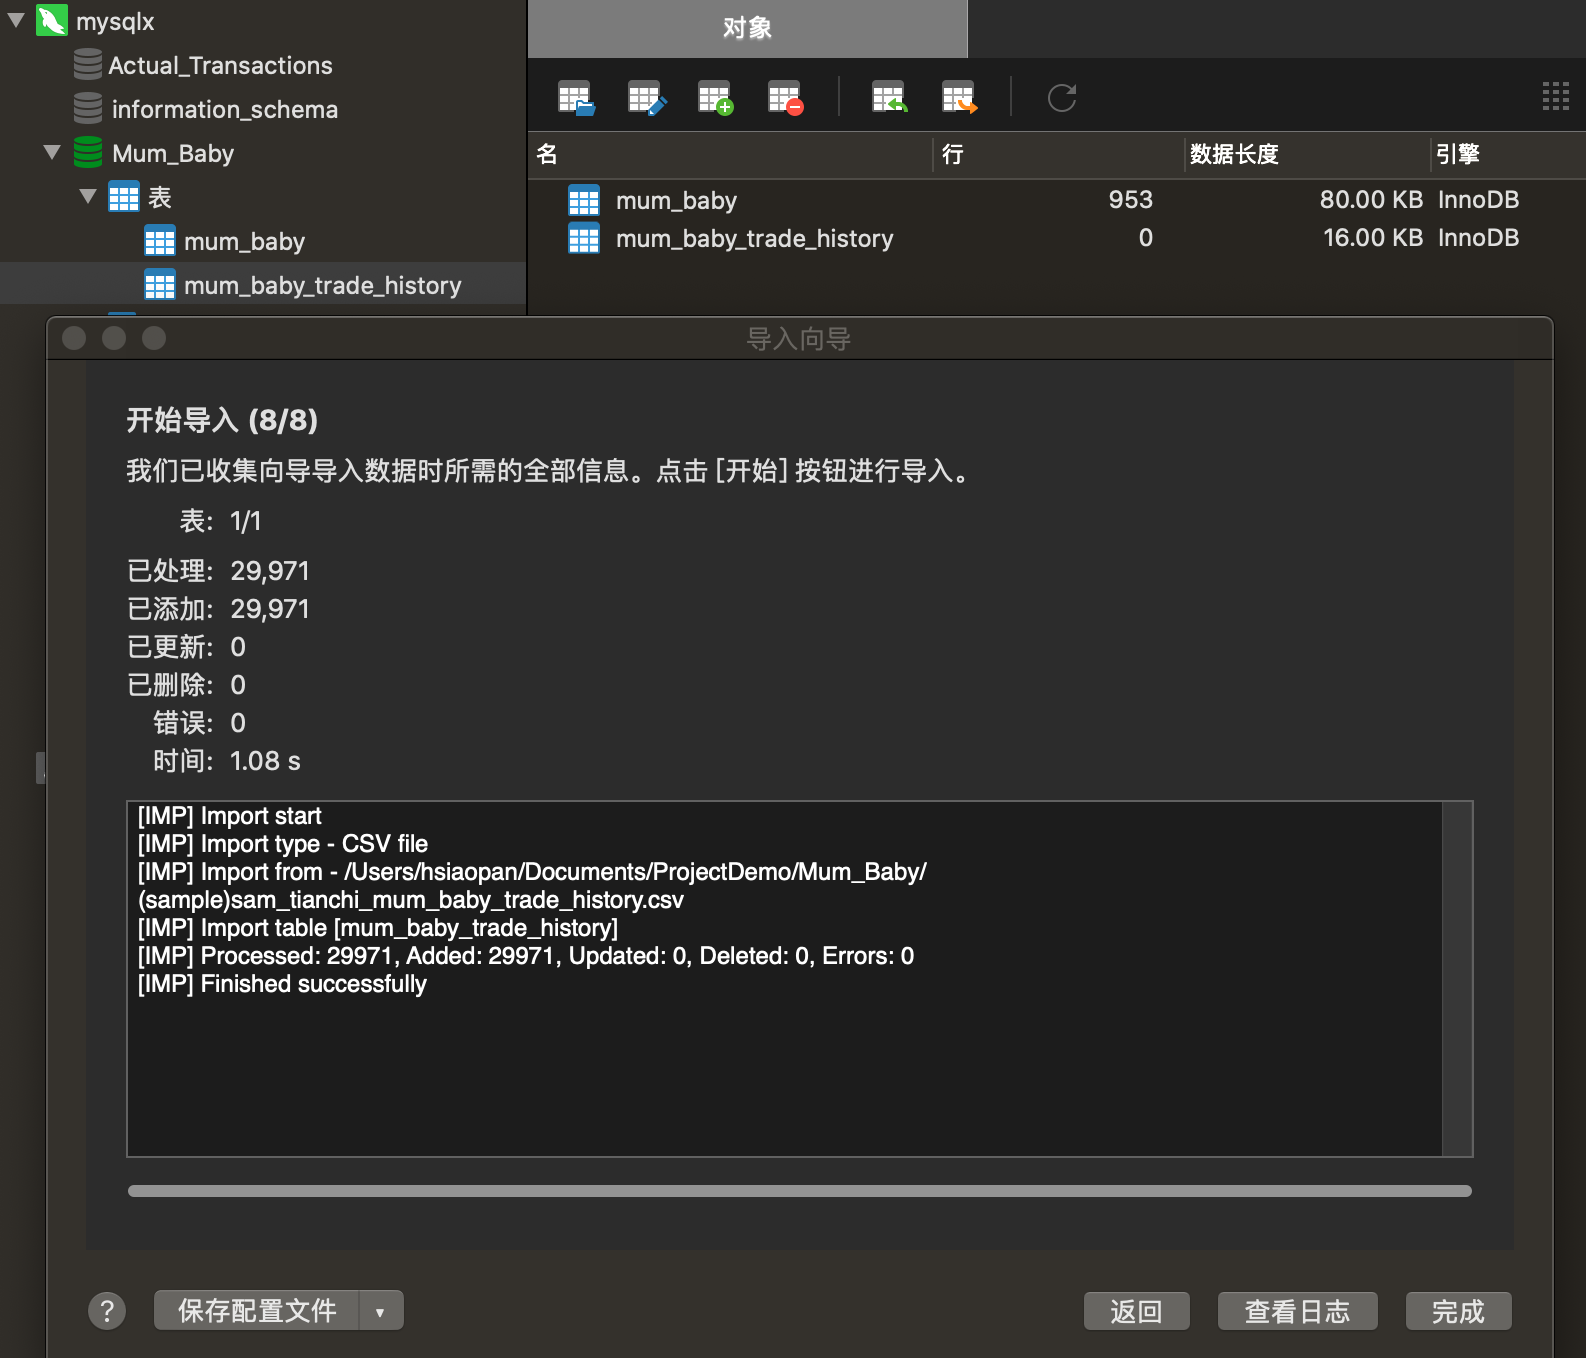
打开Navicat,连接MySQL,新建数据库 Mum_Baby ,相关参数如下:
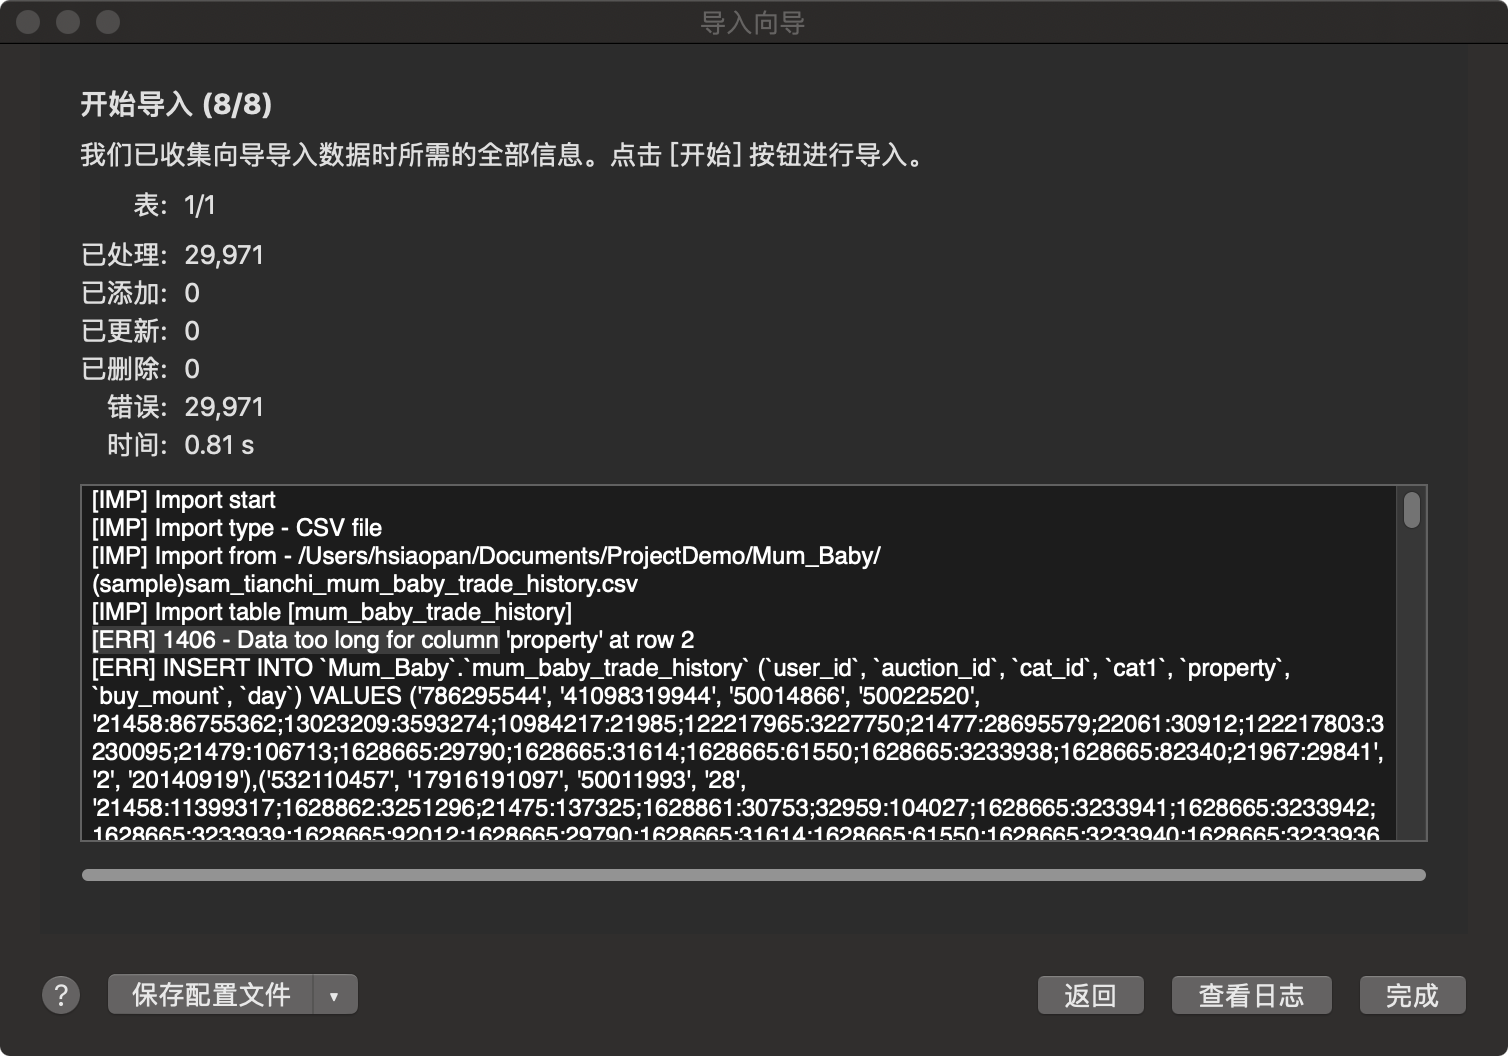
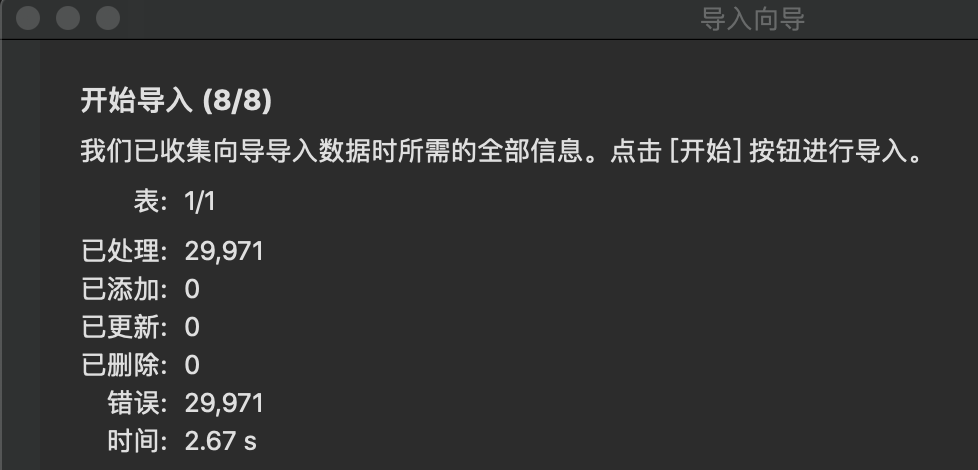
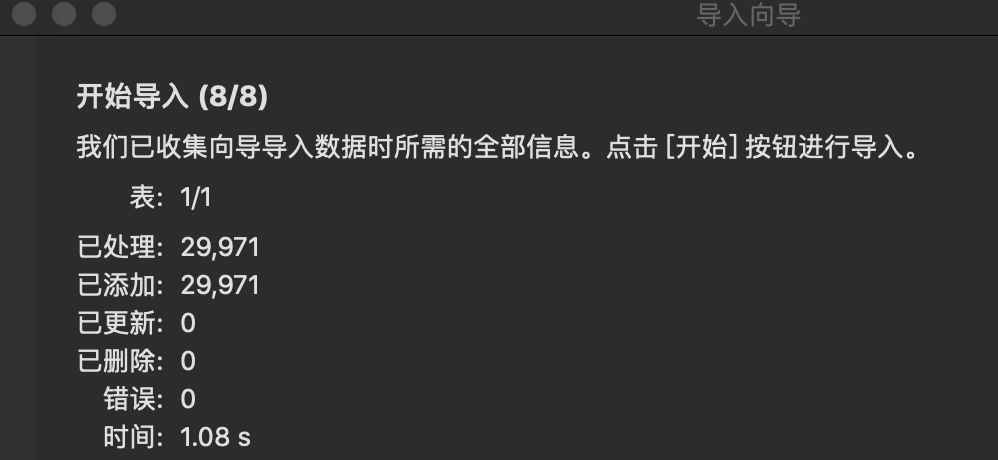
在 Mum_Baby 数据库下的表里右键选择 导入向导,开始导入数据集
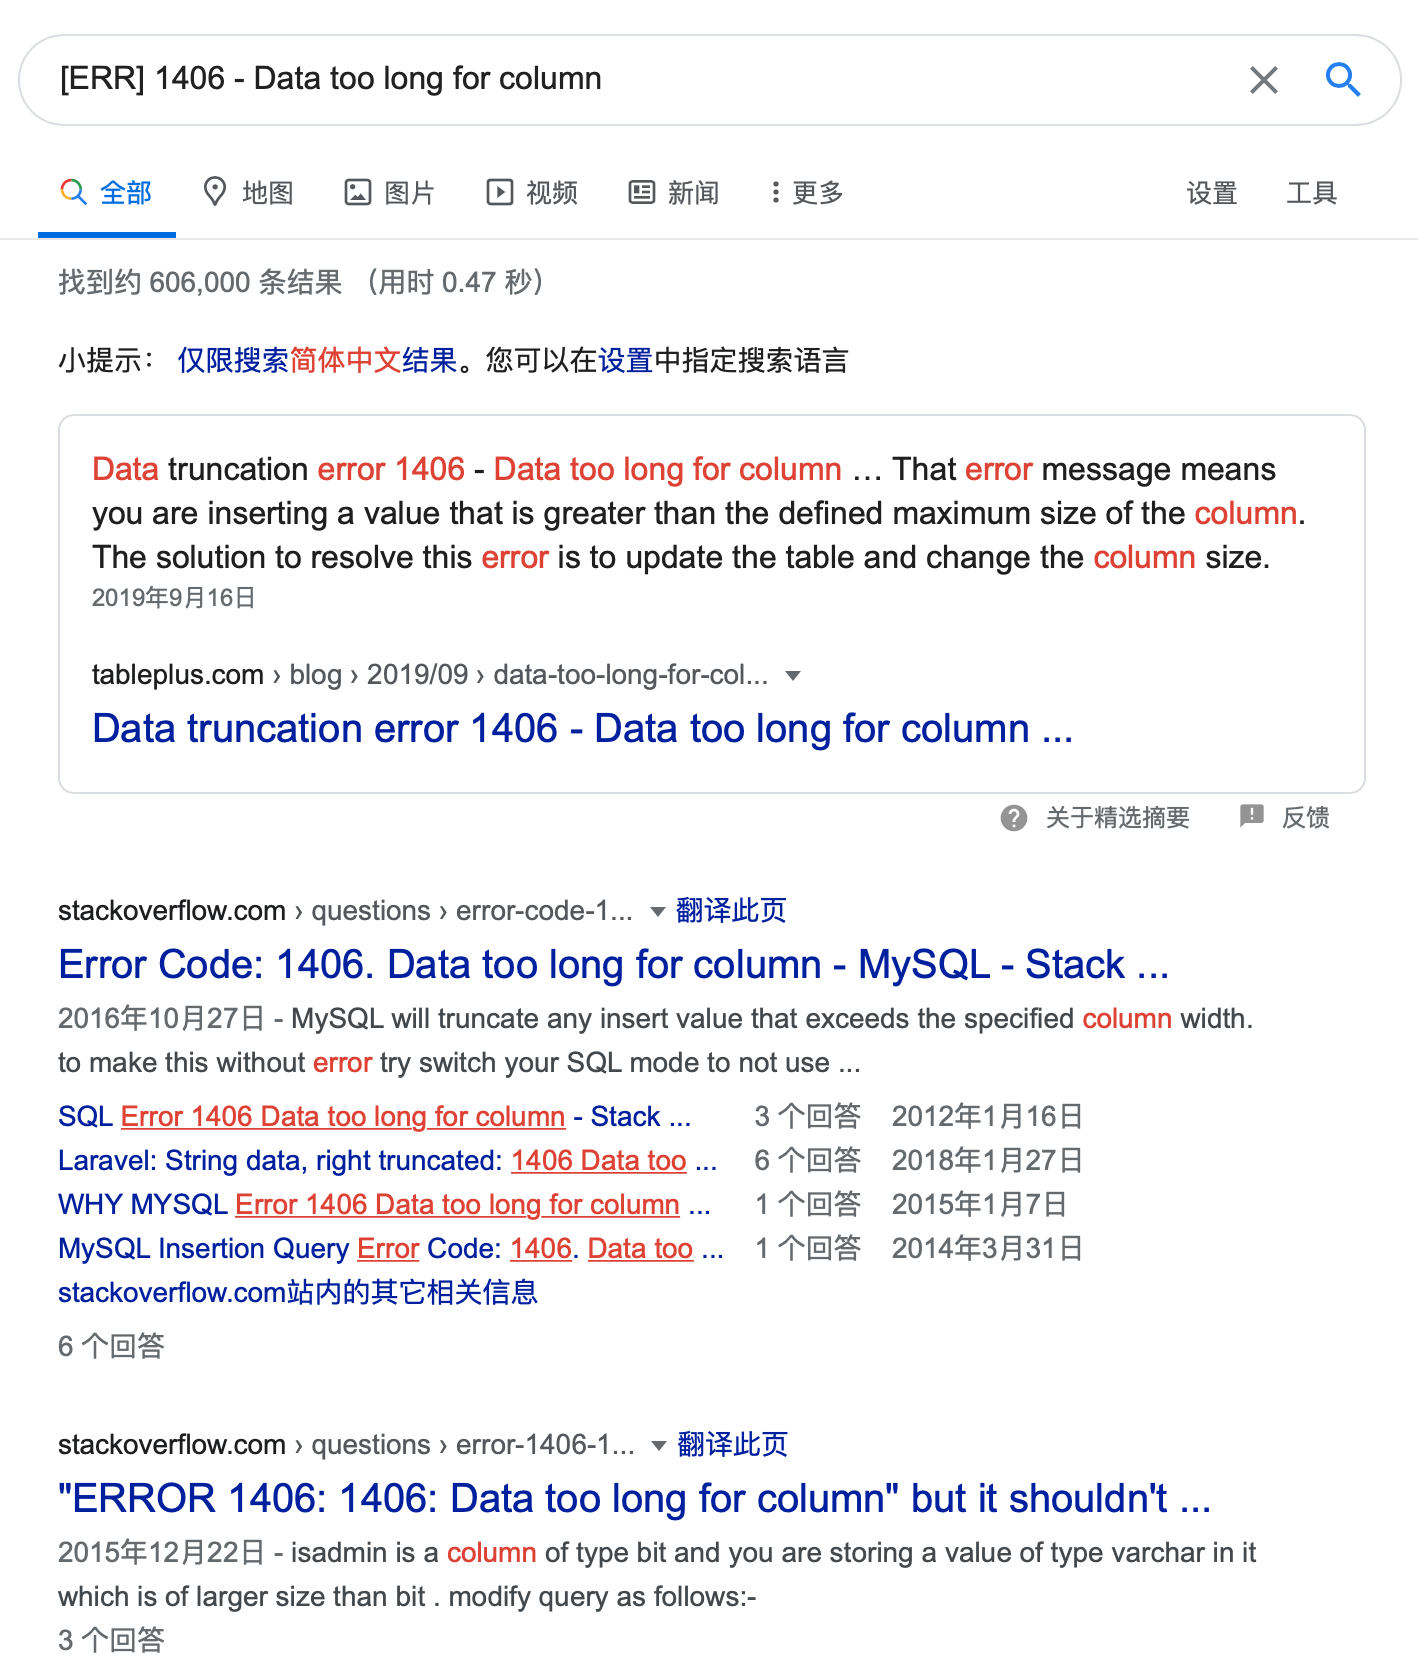
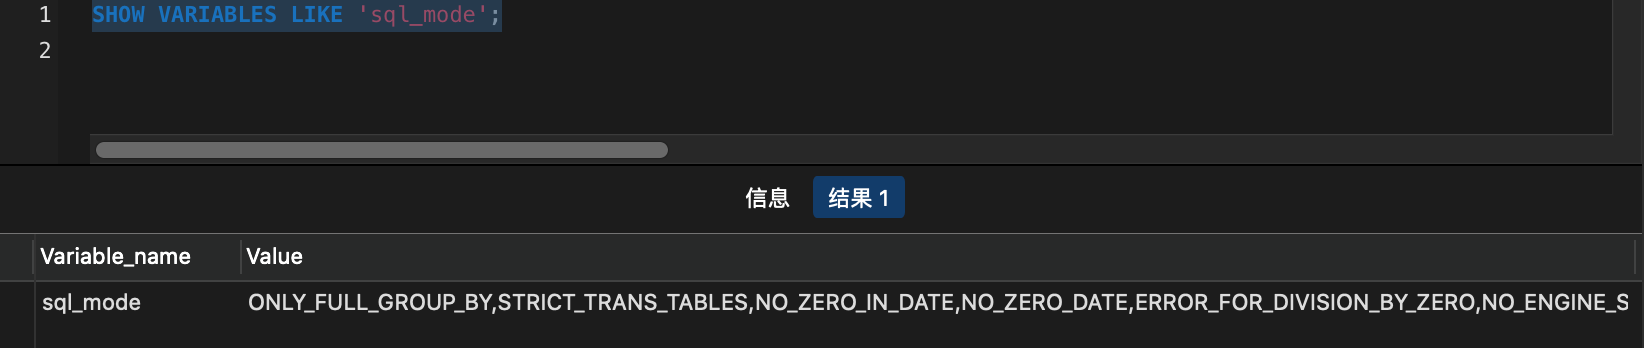
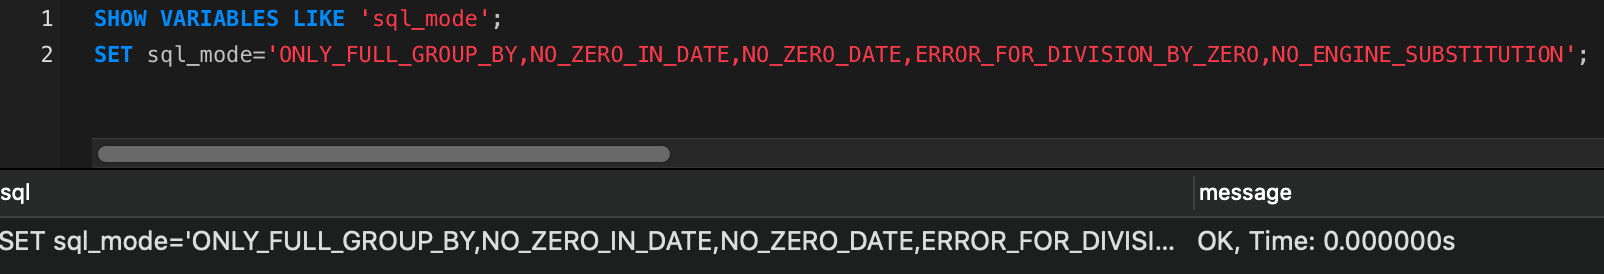
此处导入数据容易遇坑,我这次就遇上了,详情可查看另外一篇文章
MySQL导入数据 Data too long for column
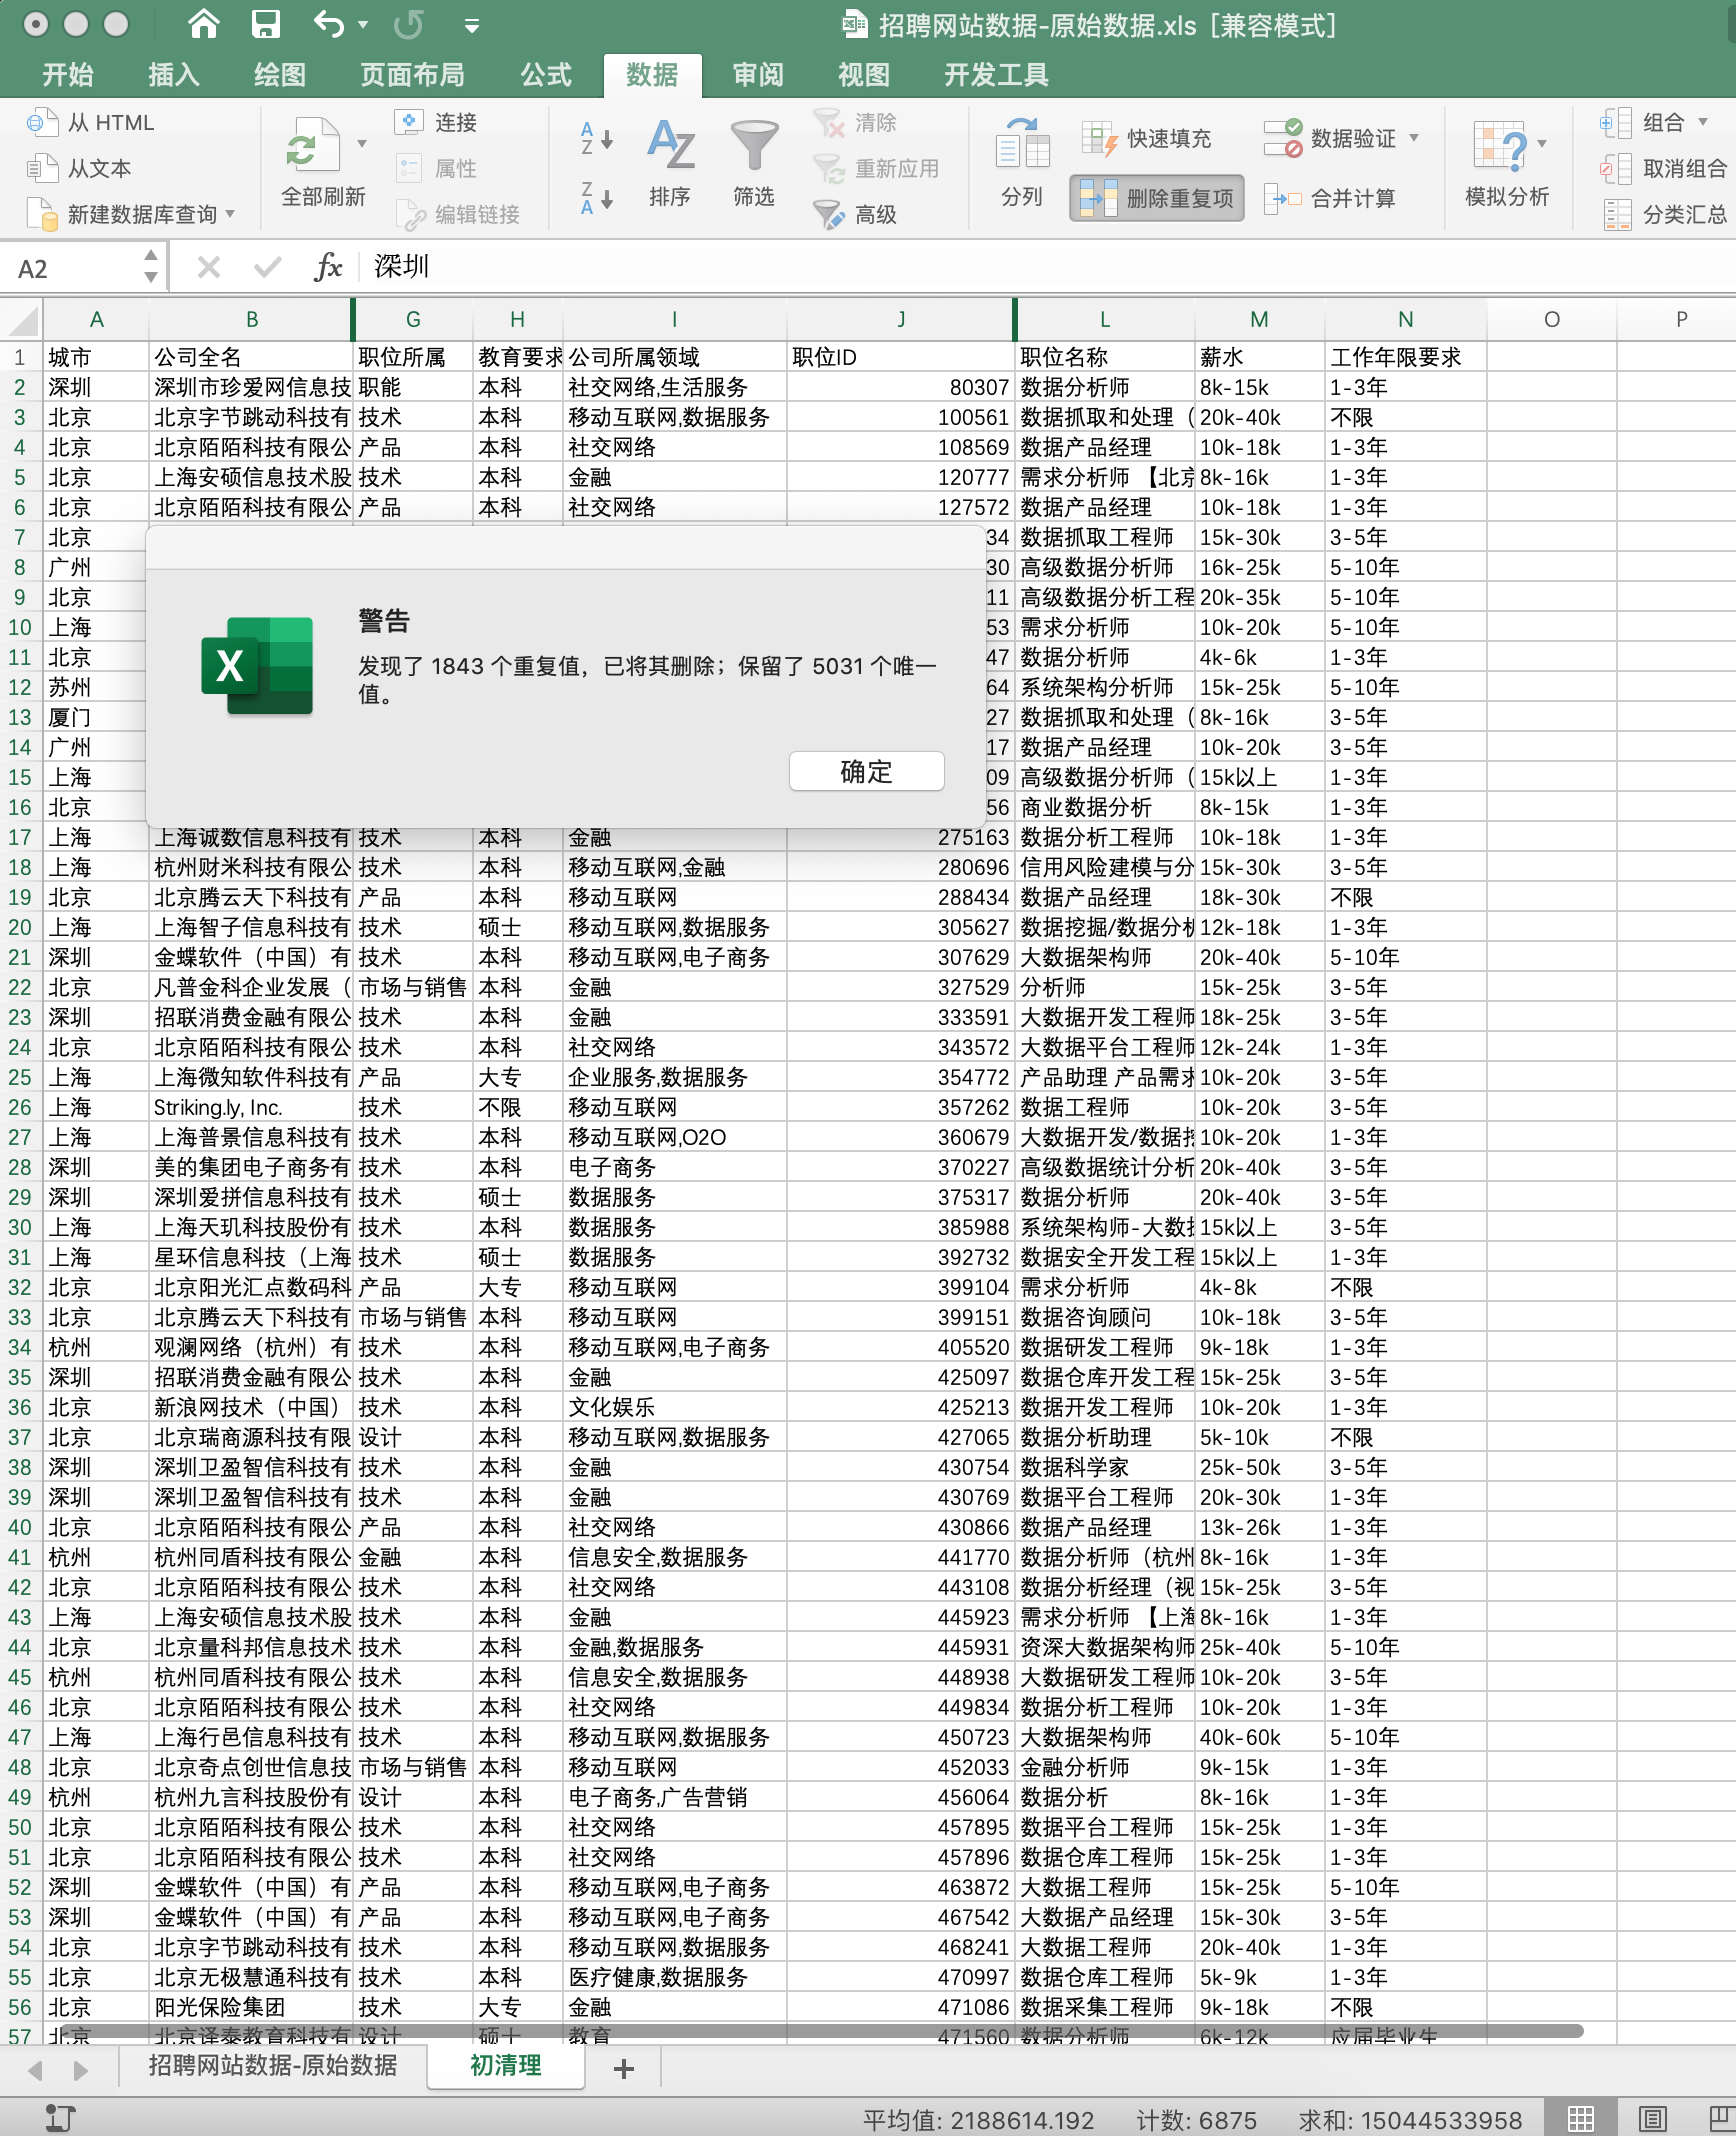
3.1 删除重复值
查询表 mum_baby_trade_history 记录数
SELECT COUNT(*) FROM mum_baby_trade_history;
返回结果 29971
通过非重复计数新建表 trade_history 并查询记录数
CREATE TABLE trade_history
SELECT DISTINCT * FROM mum_baby_trade_history;
SELECT COUNT(*) FROM trade_history;
返回结果 29971,与直接查询结果相同,说明没有重复值
3.2 缺失值处理
先判断是否有NaN值
SELECT * FROM mum_baby_trade_history
WHERE user_id IS NULL
	OR auction_id IS NULL
	OR cat_id IS NULL
	OR cat1 IS NULL
	OR buy_mount IS NULL
	OR `day` IS NULL;
返回结果为空,说明没有NaN值
3.3 空字符串处理
先判断是否有缺失值
SELECT * FROM mum_baby_trade_history
WHERE user_id = ''
	OR auction_id = ''
	OR cat_id = ''
	OR cat1 = ''
	OR buy_mount = ''
	OR `day` = '';
返回结果为空,说明无缺失值
3.4 错误信息处理
mum_baby 表中 gender 存在一些值为 2,可能为错误信息,也可能是婴儿为出生时产生的订单,客户不能判断婴儿性别。
CREATE TABLE baby_birthday
SELECT * FROM mum_baby
WHERE gender = 0
	OR gender = 1;
这里暂时将其剔除,同时新建一个表 baby_birthday
4 数据分析
以下分析,数据库操作部分通过Tableau的
自定义SQL提取数据库表的,然后通过Tableau可视化
4.1 总体业绩分析
4.1.1 母婴行业发展趋势及背景
SELECT
	COUNT(DISTINCT user_id) AS 每年客户数,
	COUNT(*) AS 每年订单数,
	extract(YEAR FROM `day`) AS 年
FROM
	trade_history
GROUP BY extract(YEAR FROM `day`)
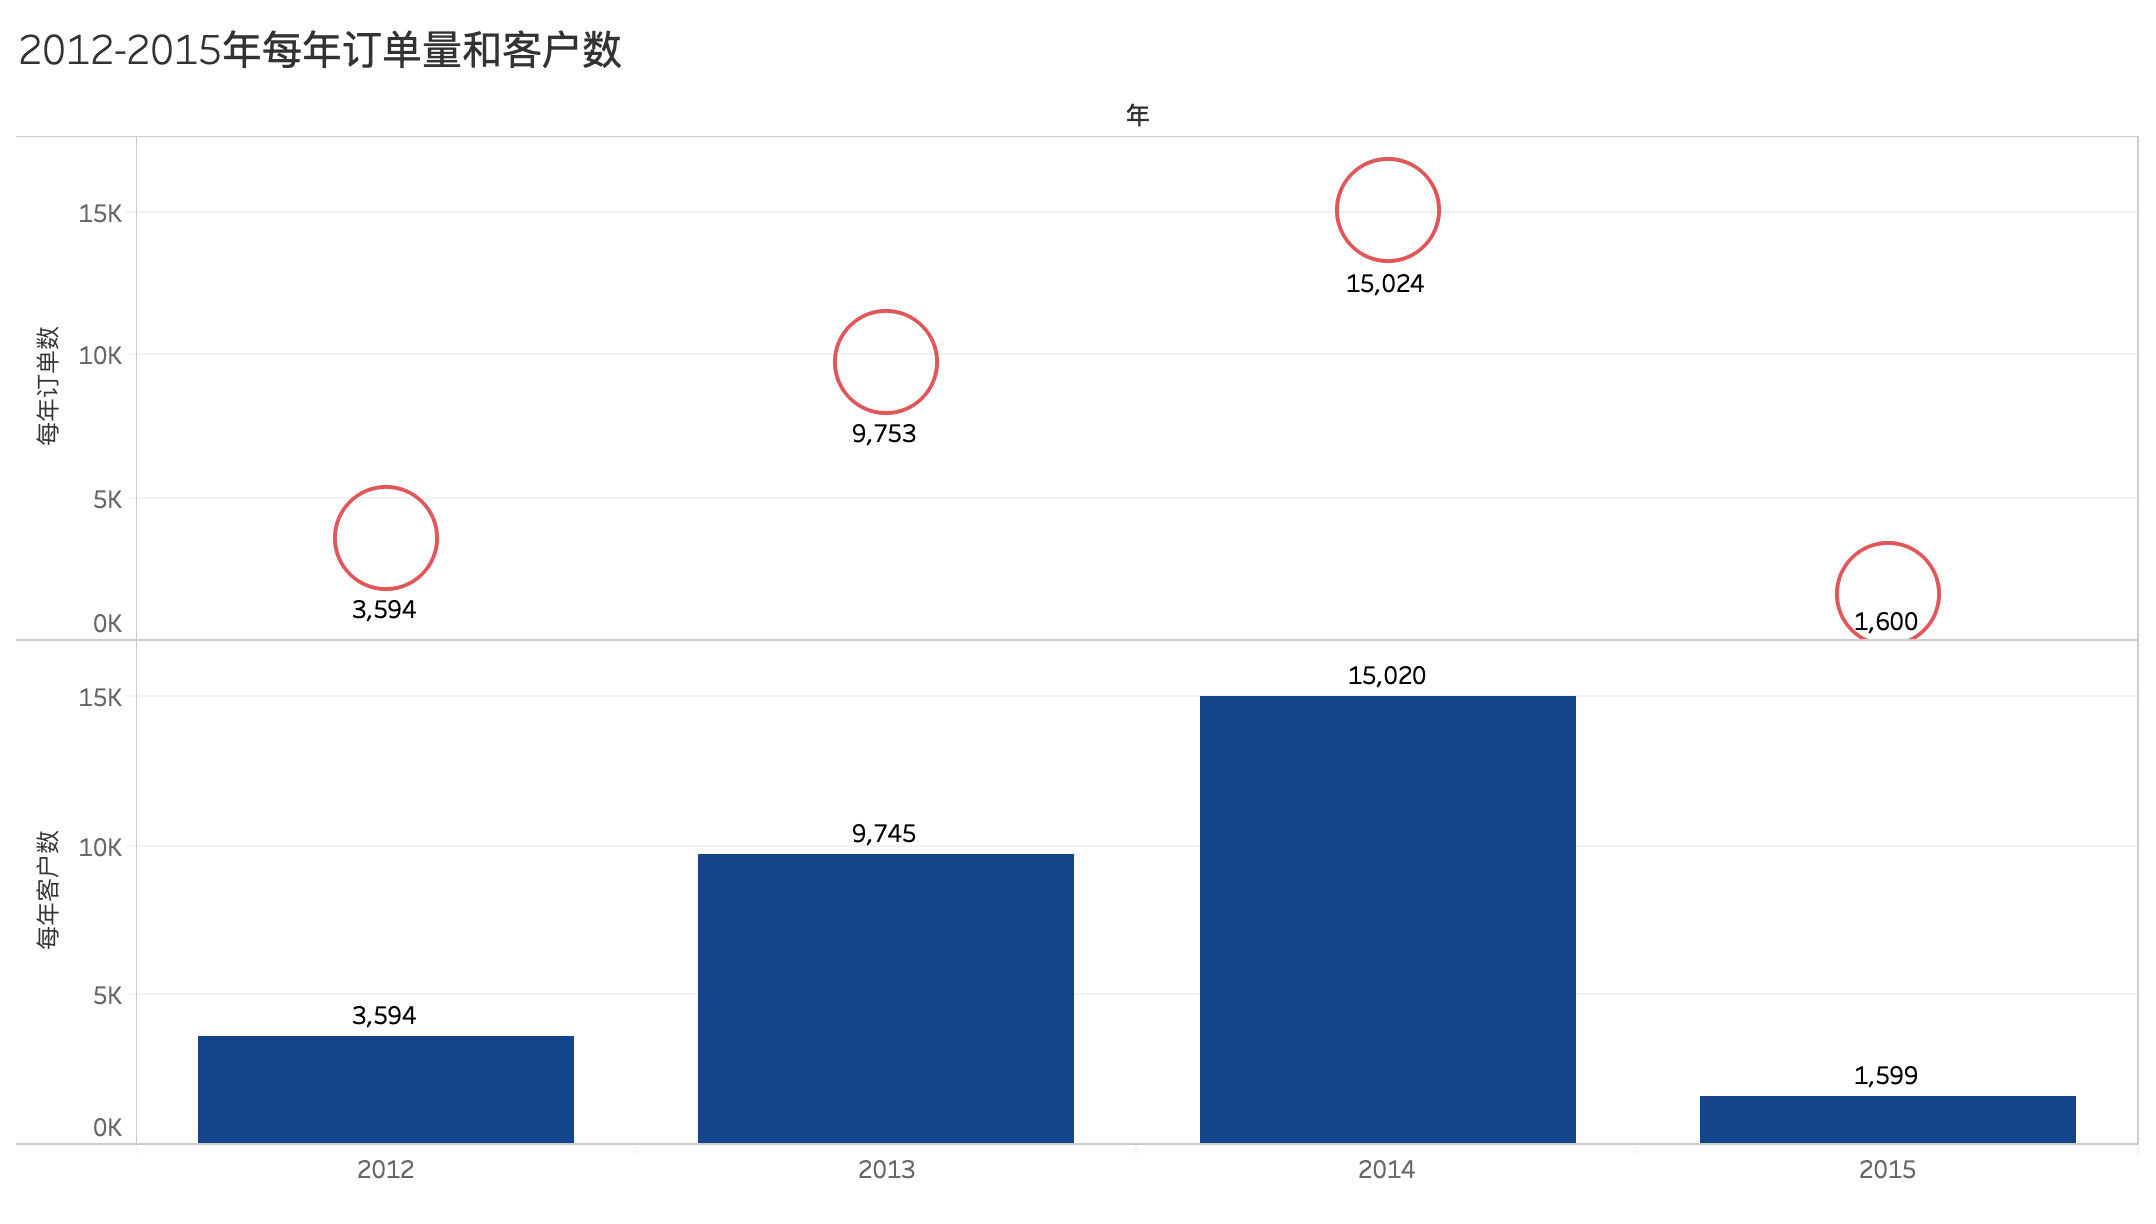
根据2012年——2015年每年订单量柱形图,发现2014年全年订单量相较2013年增长超过50%。
注:2012年和2015年数据不是全年数据,无法参与对比。
尝试通过PEST方法进行初步分析增长原因。
PEST(Political、Economic、Social、Technological)分析模型是环境分析的一种方法,通过对政治、经济、社会、技术四方面的若干影响因素进行总结和列出相对关键和重要的影响因素。
- 政治因素:2013年12月28日,《关于调整完善生育政策的决议》通过,一方是独立子女的夫妇可生育两个孩子的单独二孩政策依法启动实施。政策的放宽,意味着符合条件的家庭可以生育二孩,对母婴市场是利好政策。
- 经济因素:首先是中国人均GDP这几年稳步增长,国民的消费水平也同步提高;其次是2014年互联网企业赴美IPO,京东、阿里均在美国上市。
- 社会因素:其一,国家对优生优育的宣传持续力度加大;其二,这几年新出生人口基数大,1600余万,且有小幅增长。
- 技术因素:母婴产品多样化,这些都是技术进步带来的。
从以上PEST模型中,对增长影响较大的因素,推断为政策因素(独立二孩)和社会因素(优生优育和人口基数大)。
4.1.2 母婴行业的淡季和旺季
取每月订单量进行对比
SELECT
    count( DISTINCT user_id ) AS 每月客户数,
    count( * ) AS 每月订单数,
    extract( YEAR FROM `day` ) AS 年,
    extract( MONTH FROM `day` ) AS 月
FROM
    trade_history
GROUP BY
    extract( YEAR FROM `day` ),
    extract( MONTH FROM `day` )
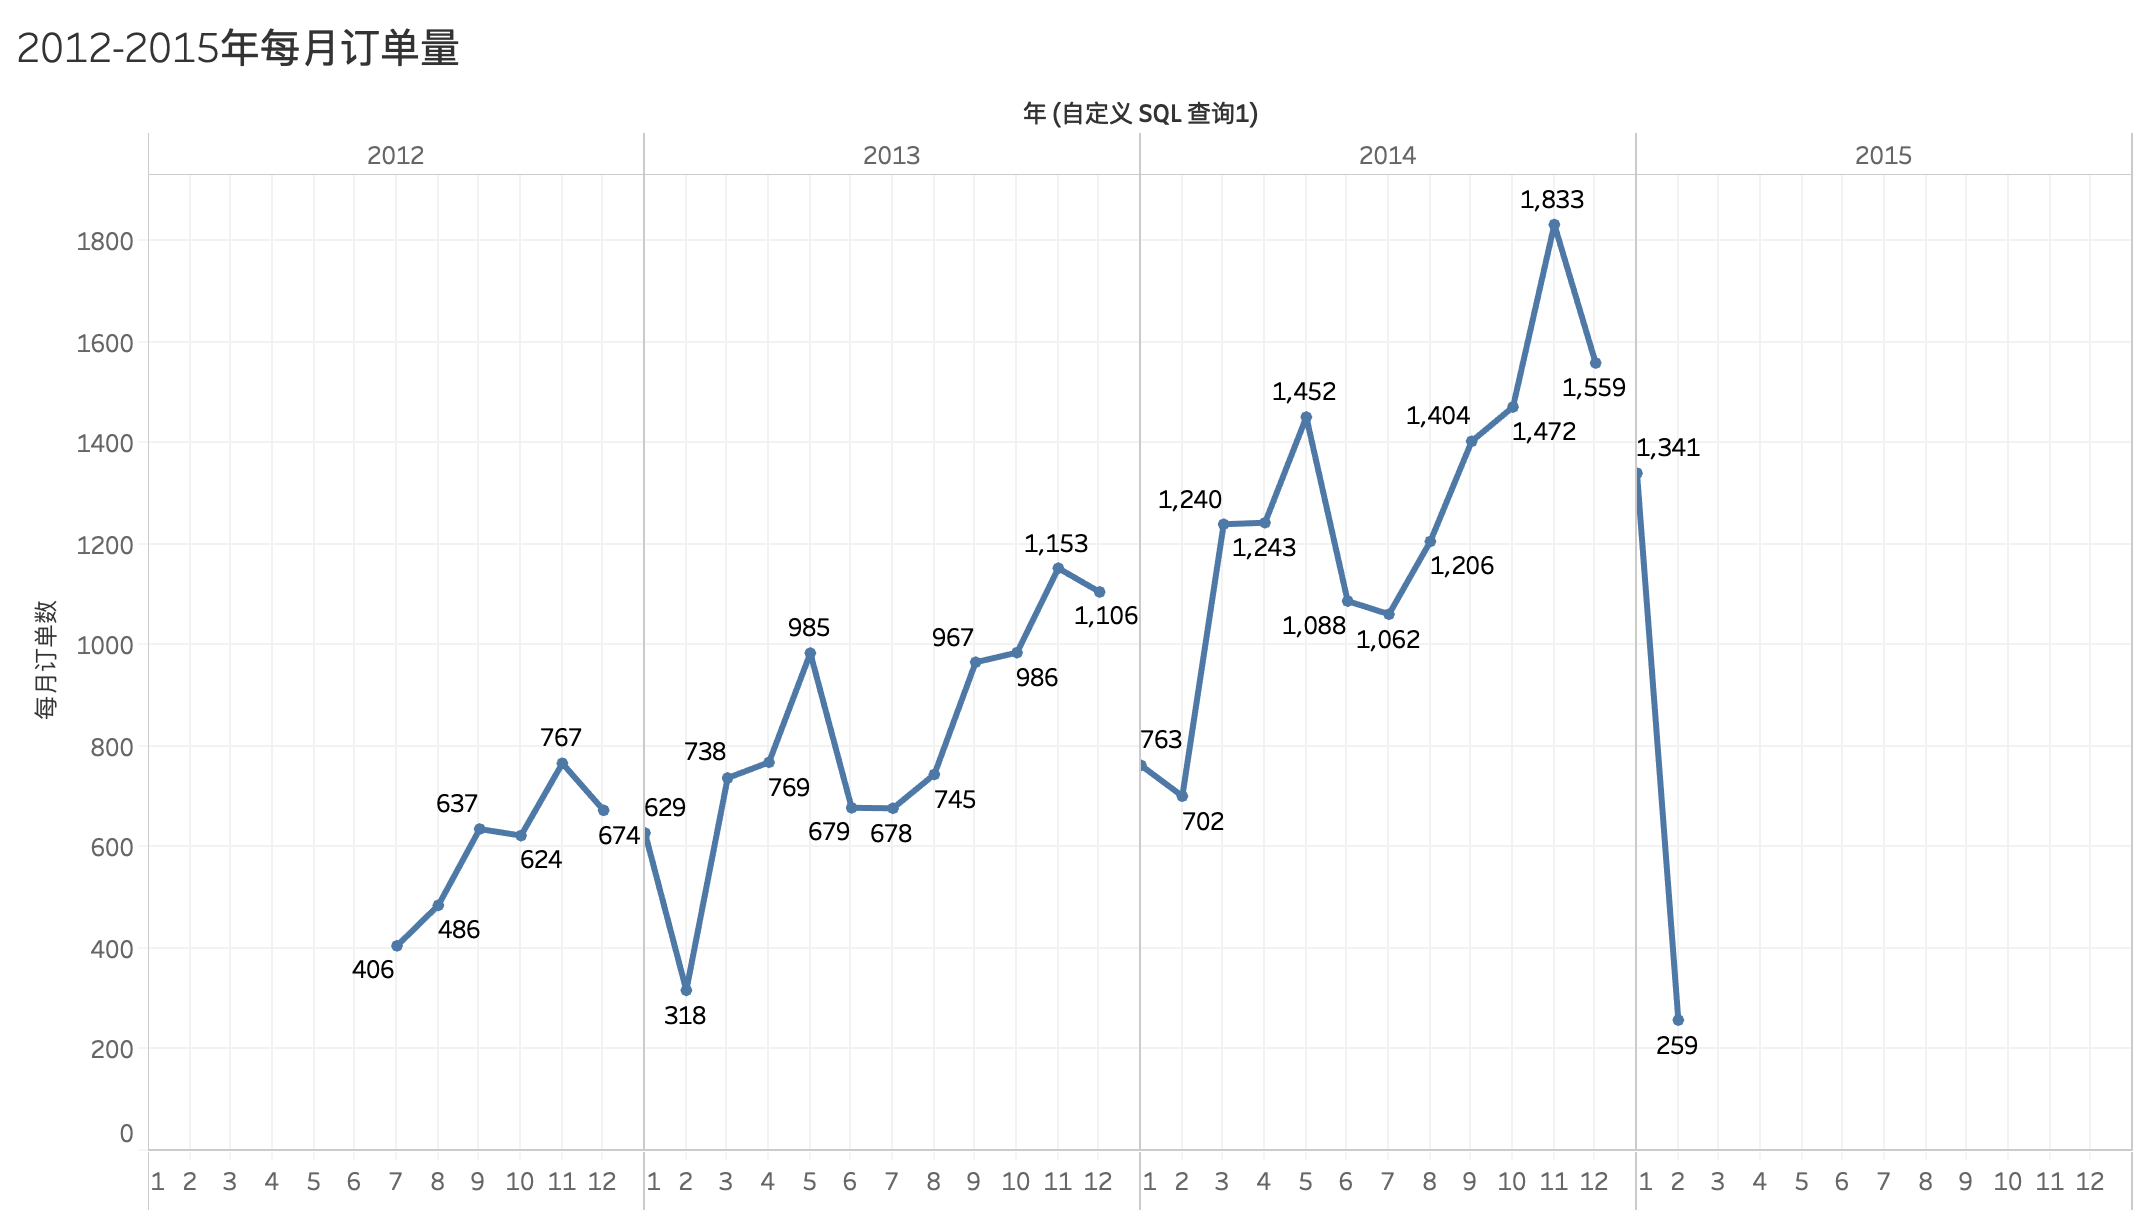
根据月份统计订单量折线图,可以发现2013年与2014年趋势走向相似:
* 3-5月、8-11月呈正增长
* 6-7月、12-1月呈负增长
其中2月年度最低点,11月达到峰值。
筛选2013年和2014年,以订单量作盒须图,视订单量为前25%的月份为旺季,订单量后25%的月份为淡季
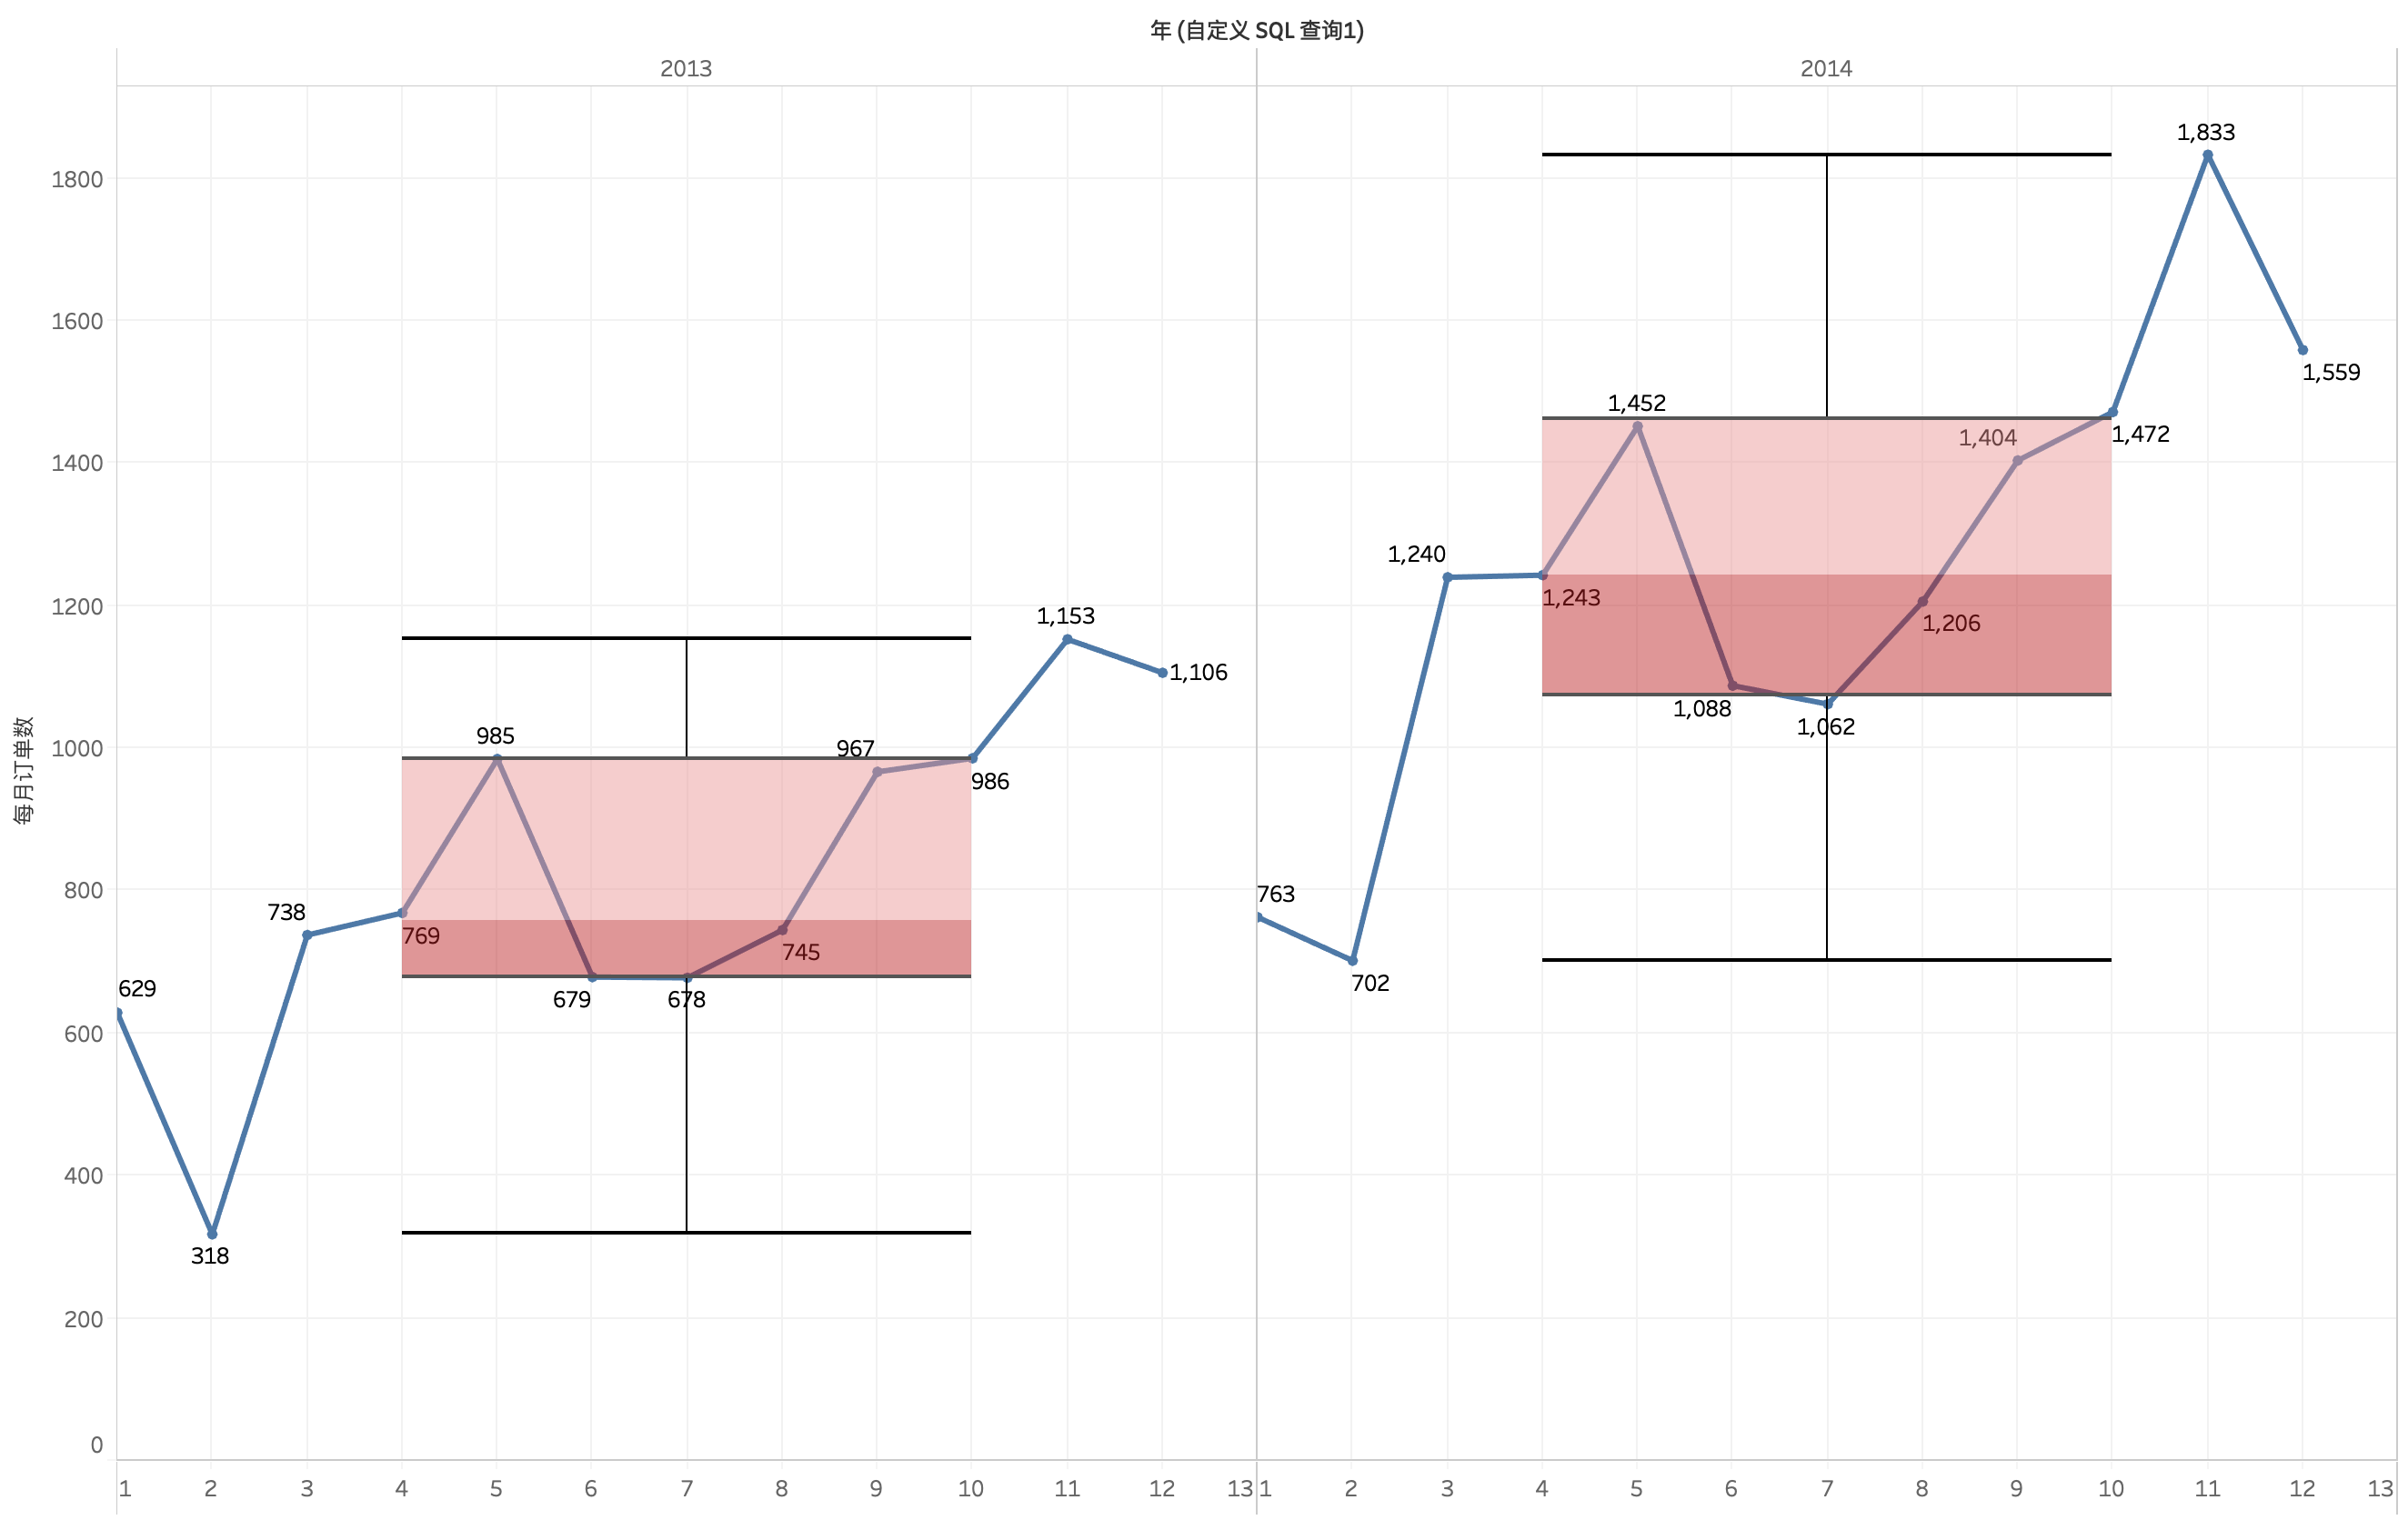
* 旺季:10、11、12月
* 淡季:1、2、7月
4.1.3 Top10消费日
提取订单量前十的日期
SELECT
    EXTRACT( YEAR FROM `day` ) AS 年,
    EXTRACT( MONTH FROM `day` ) AS 月,
    EXTRACT( DAY FROM `day` ) AS 日,
    EXTRACT( * ) AS 每日订单数
FROM
    trade_history
GROUP BY
    EXTRACT( YEAR FROM `day` ),
    EXTRACT( MONTH FROM `day` ),
    EXTRACT( DAY FROM `day` )
ORDER BY
    COUNT( * ) DESC LIMIT 10
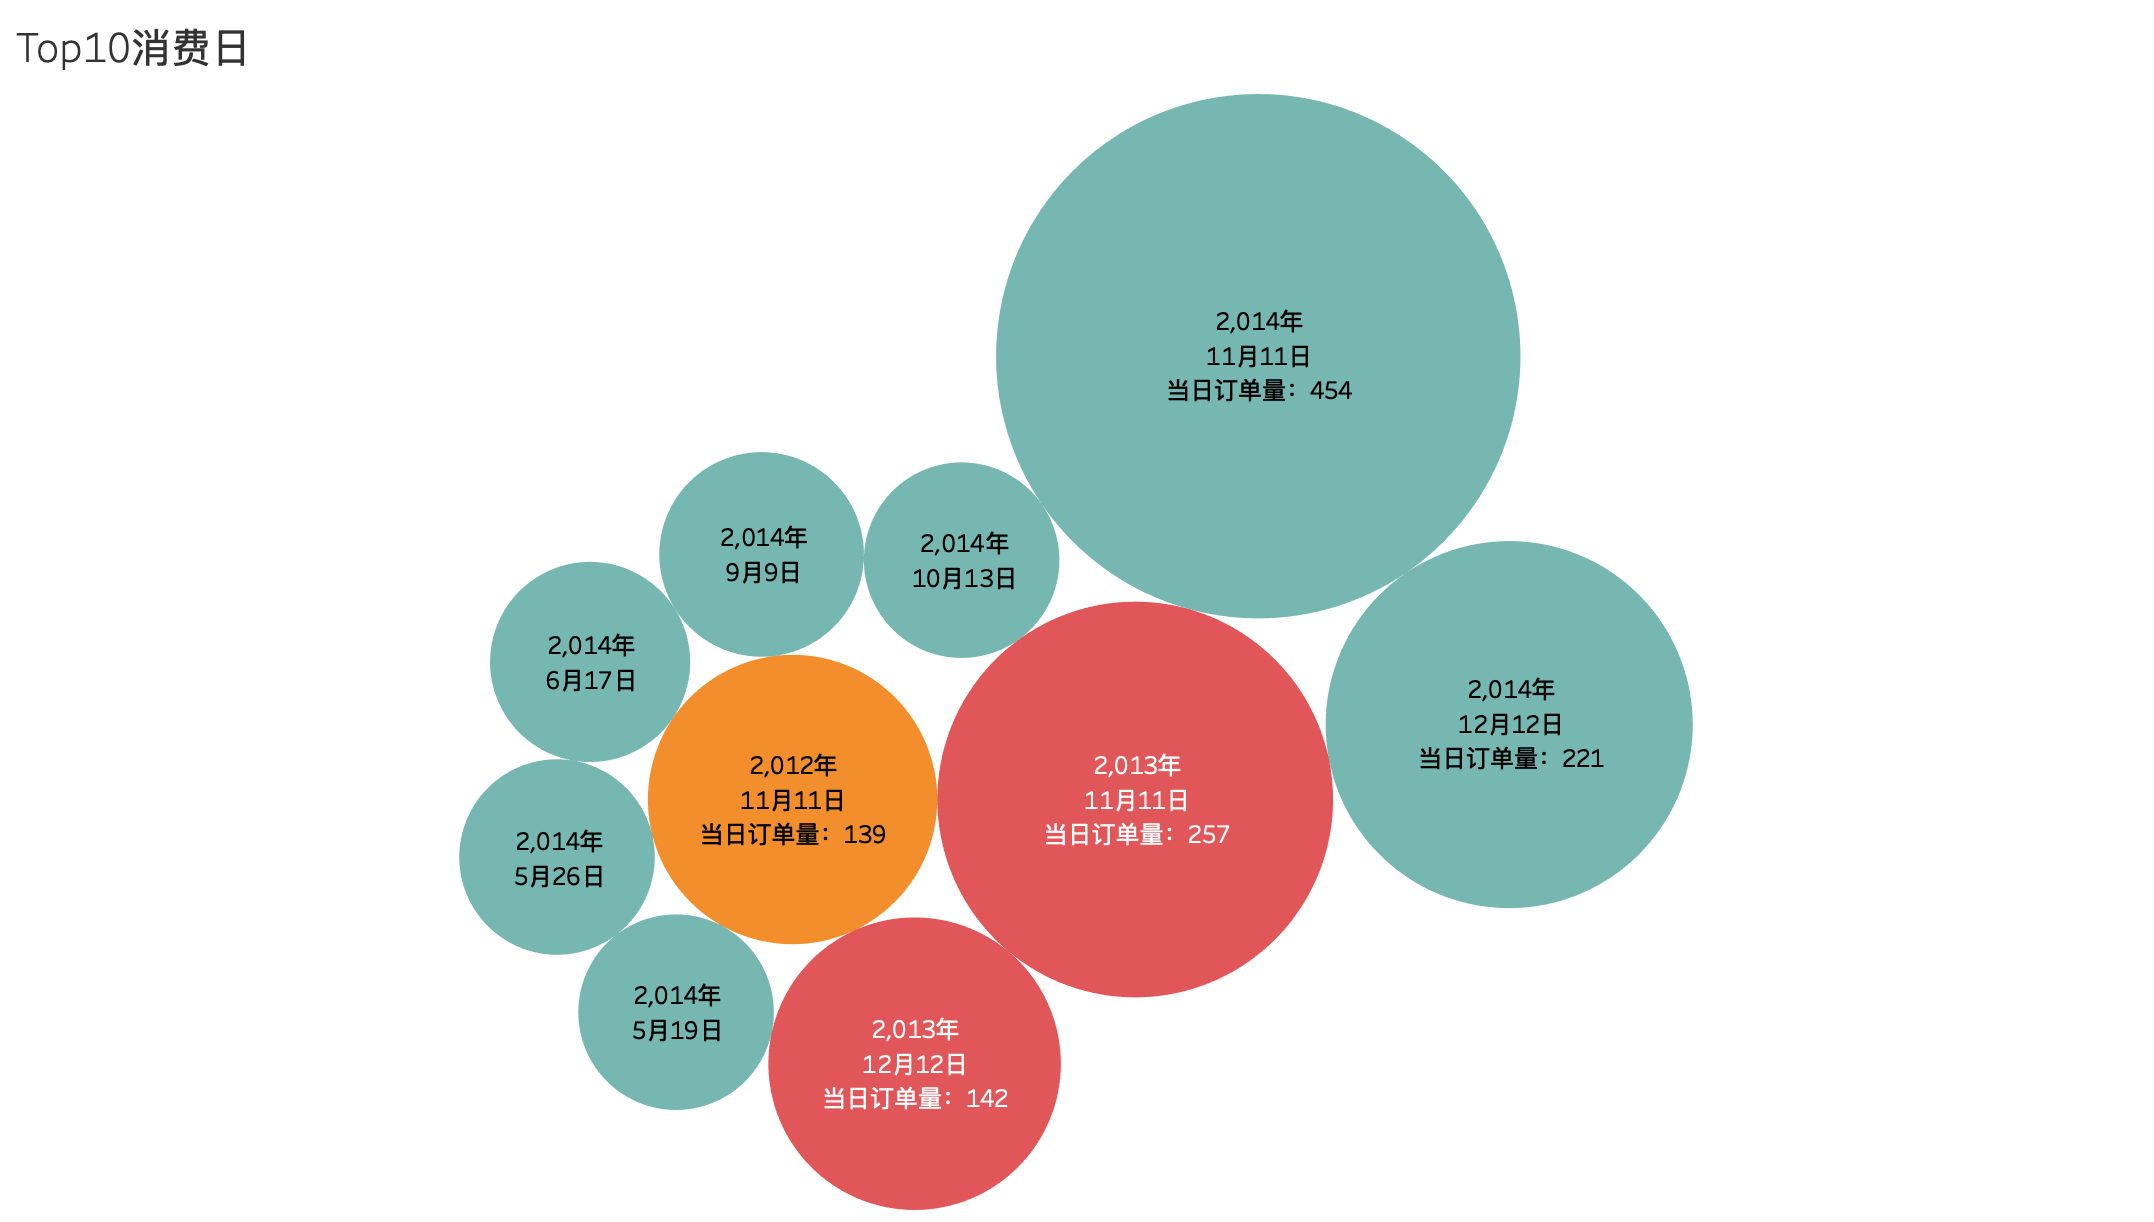
从泡泡图可以看出,双十一单日销量最高,其次是双十二。
没有看到2012年双十二,是因为双十二购物节始于2013年。
4.1.4 全年订单量最低月份
筛选2013年2月和2014年2月每日订单量做折线图对比
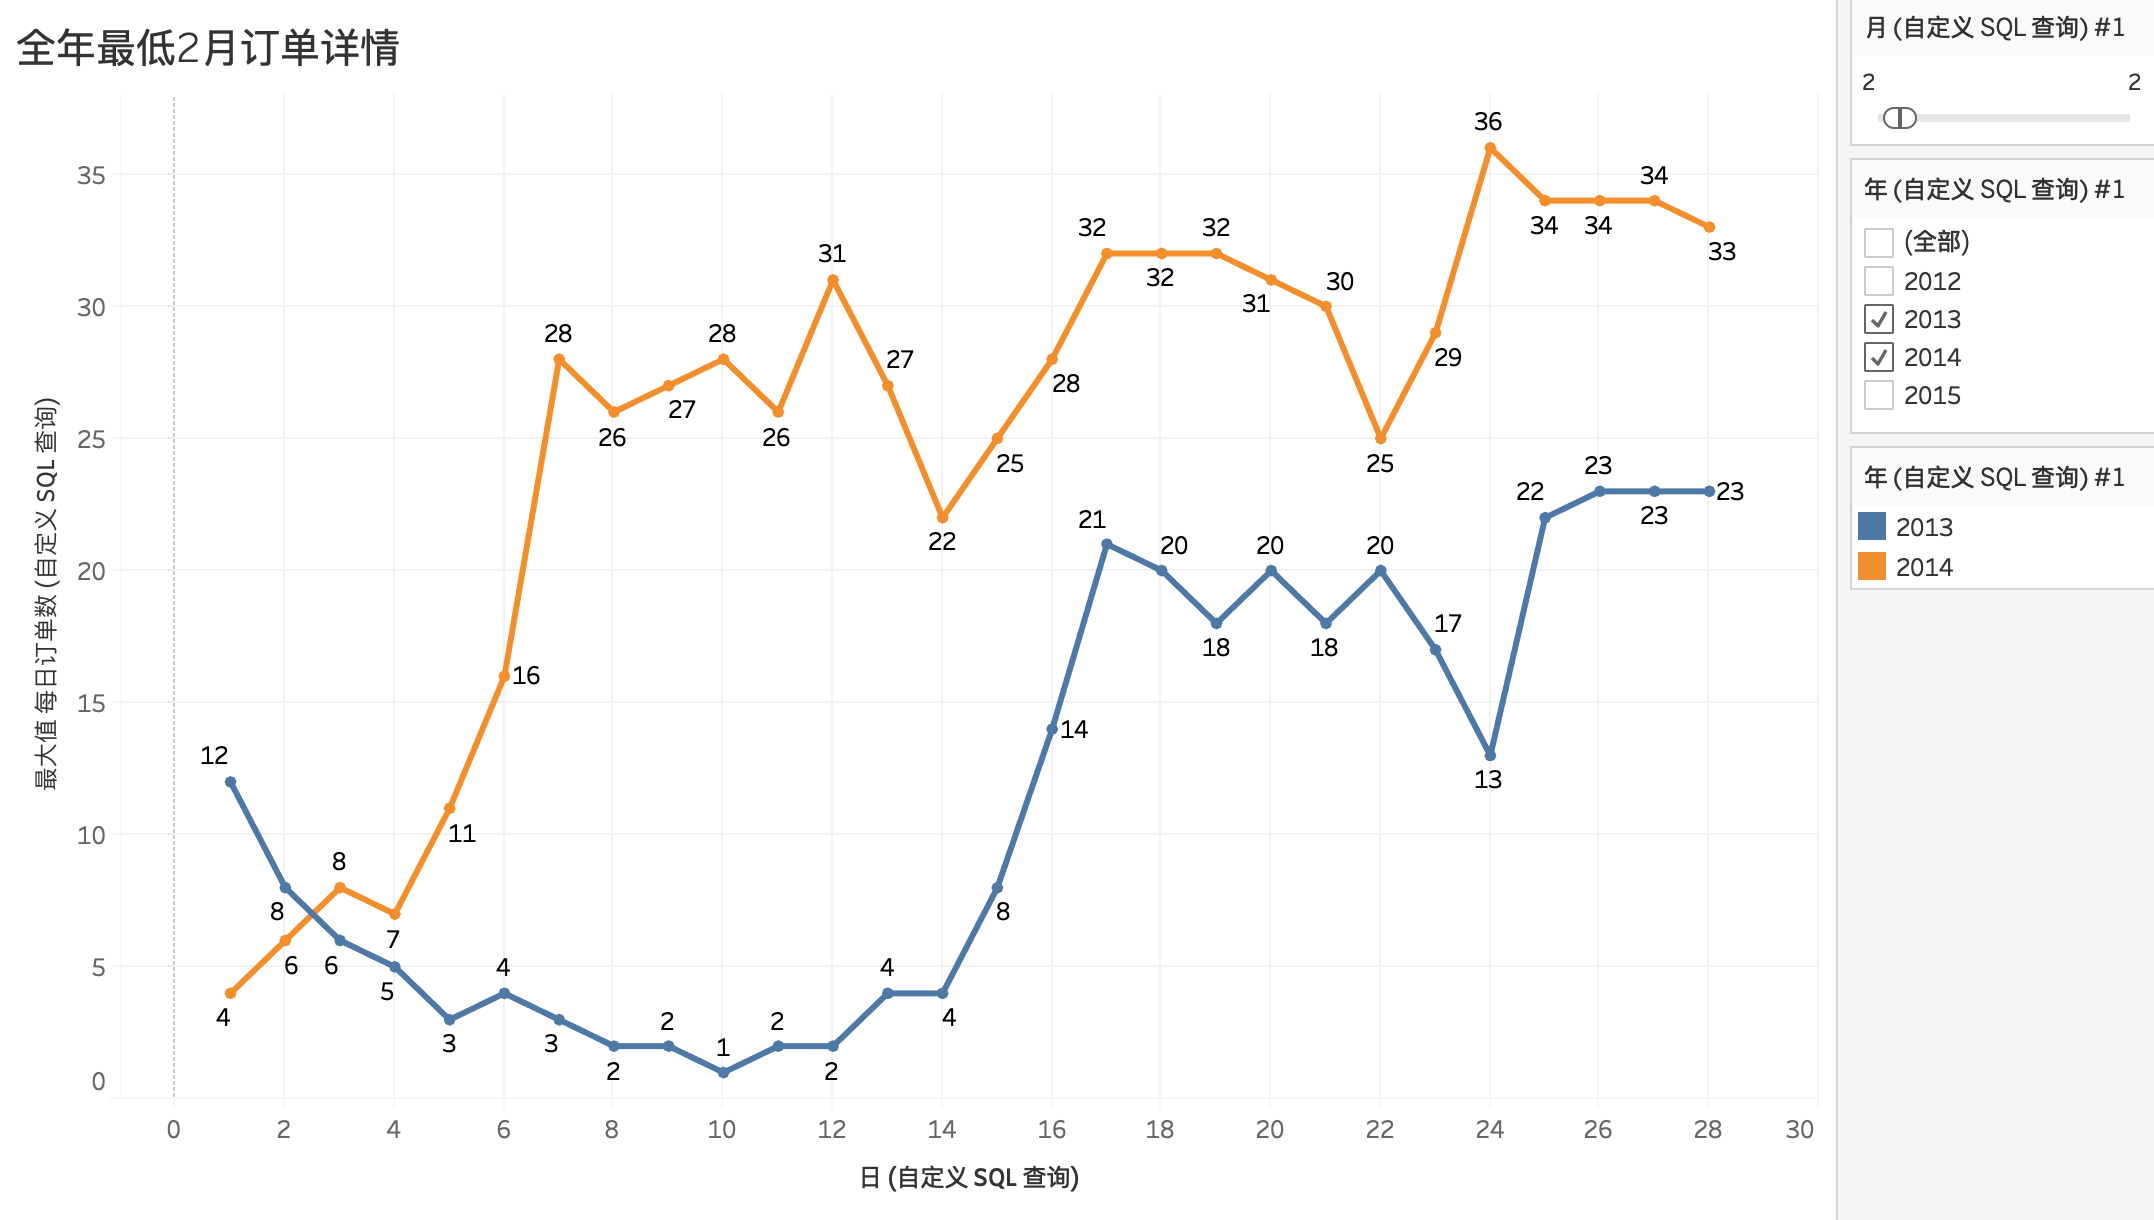
折线图呈现出该月每日订单量曲线在2013年和2014年差别很大,分析原因可能是过年期间全国放假时间不同导致。
2013年的春节假期2月9日——2月15日,2014年春节假期1月30日——2月5日
所以订单量下降到回升,是因为春节节前至春节期间全国放假,物流停运,节日之后复工,订单量上升。
4.1.5 全年订单量最高月份
筛选2012年、2013年、2014年的11月份做折线图对比
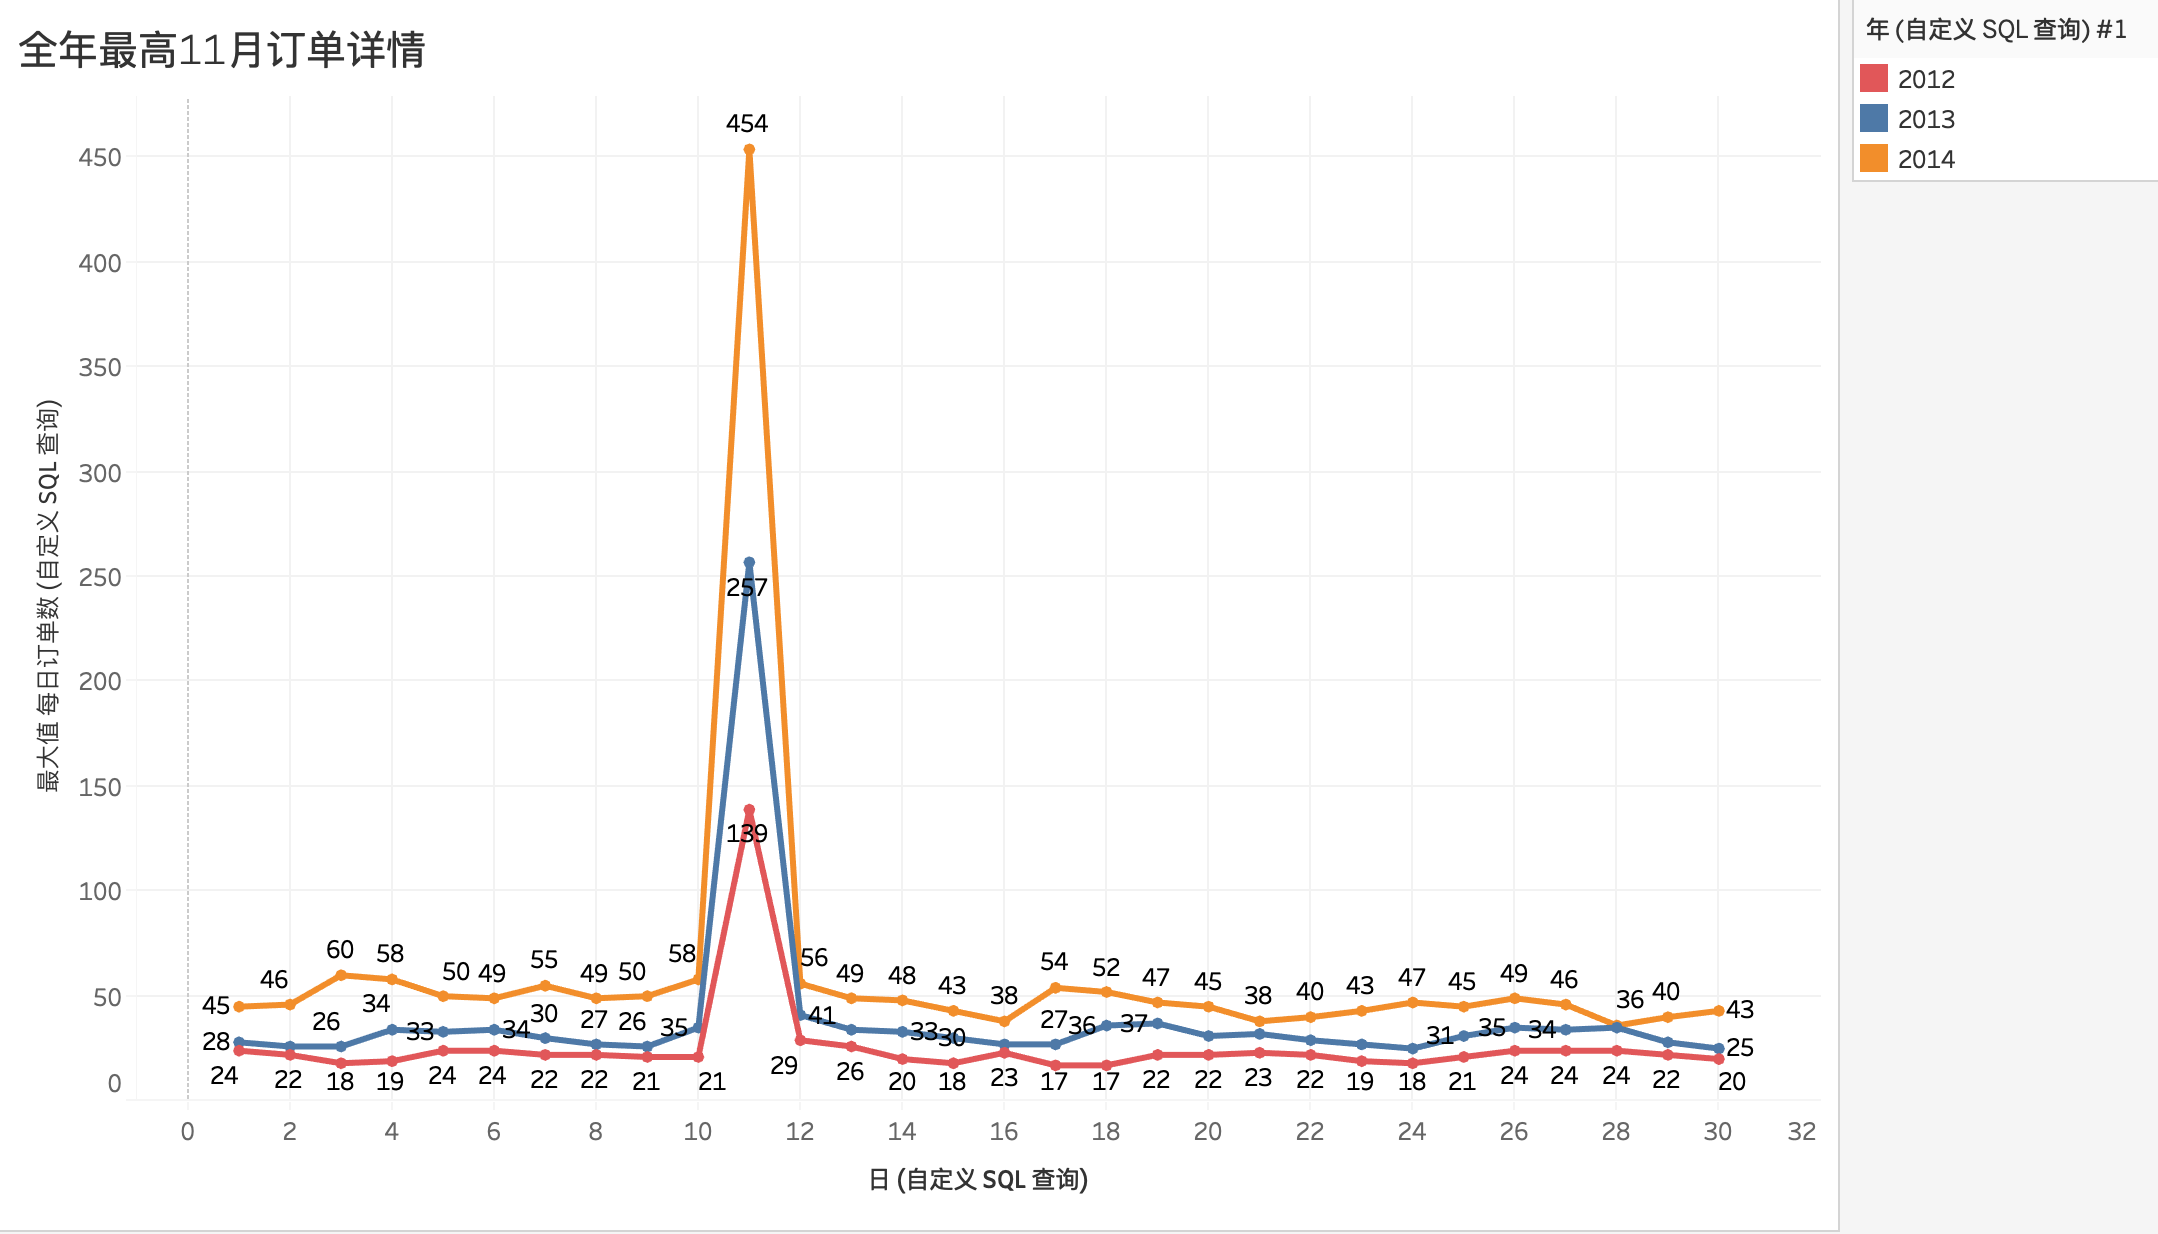
整个11月份的日订单量趋势特征非常明显,11.11日当日订单量占比整个11月总订单量20%左右,且比重逐年增加。说明双十一购物节受到广泛认同,且影响越来越大。
4.2 客户价值分析
4.2.1 用户回购率
根据不同购买次数来统计客户量
SELECT
    COUNT(user_id) AS 购买次数,
    user_id
FROM
    trade_history
GROUP BY
    user_id
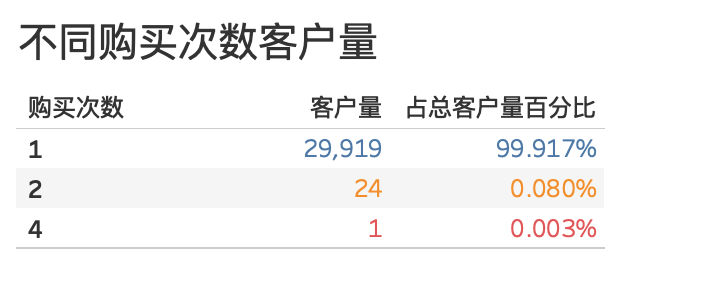
只有25名客户有复购(购买次数大于1次)行为,回购率仅为0.083%,用户粘度极低。
4.2.2 母婴市场主要消费人群
根据有复购行为的客户最后一次消费时间节点,老客户订单量与当月订单量对比
- 提取最近消费时间
SELECT
    user_id,
    MAX(`day`) AS 最近消费时间
FROM
    trade_history
GROUP BY
    user_id
ORDER BY
    MAX(`day`) DESC
- 提取消费频次大于1的客户信息
SELECT
    user_id
FROM
    trade_history
GROUP BY
    user_id
HAVING COUNT(user_id) > 1
- 将二者联接
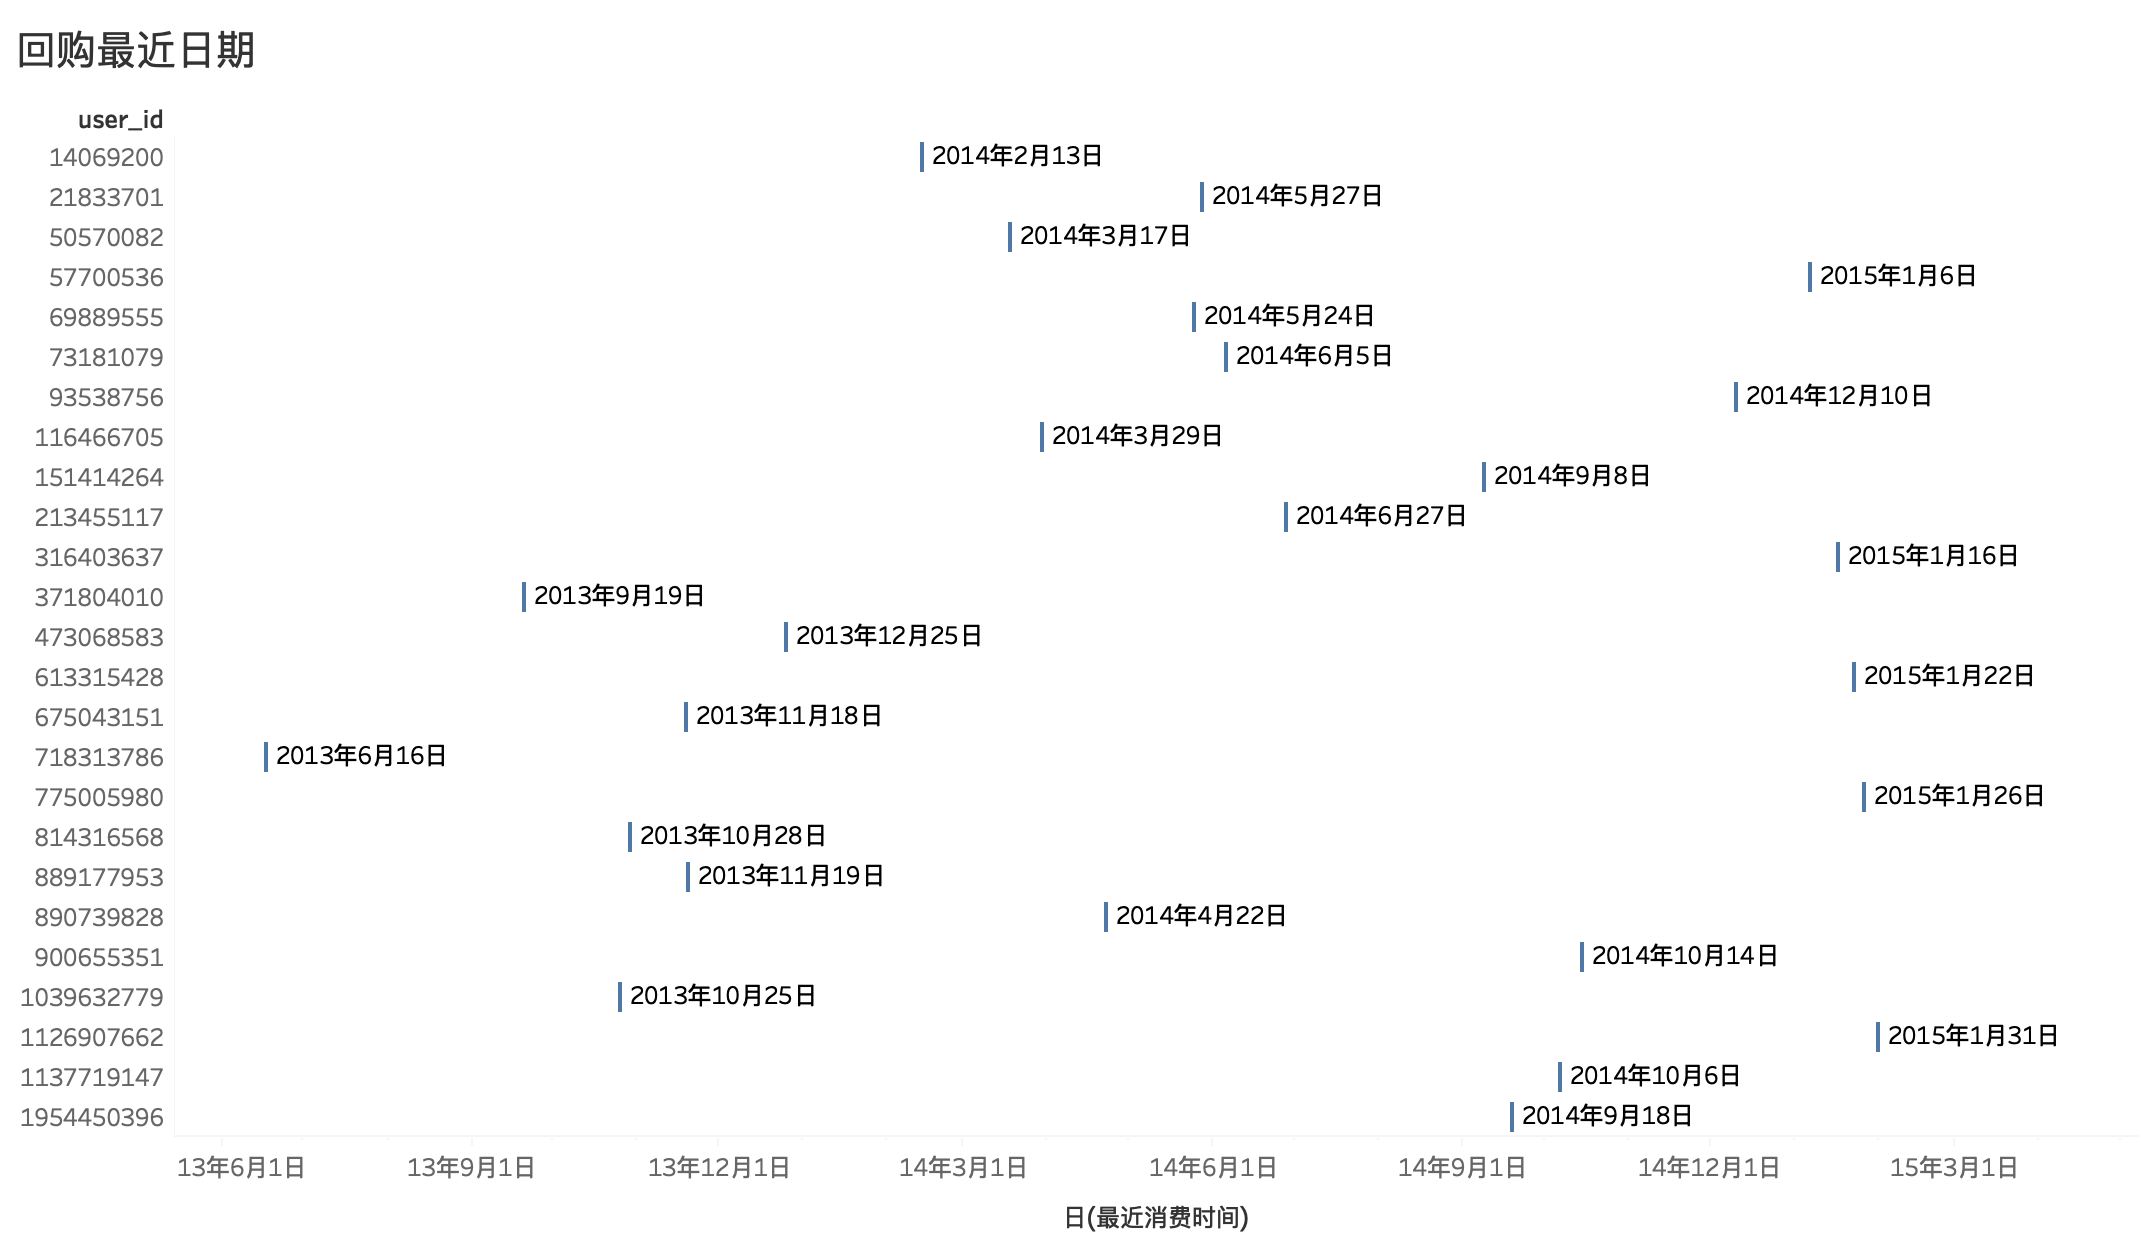
前面的分析已经知道母婴产品市场的回购率很低,大部分客户都是一次消费。在有回购的客户中,有5名客户在2015年1月进行了复购,而当月总计客户数为1314位,由此看出母婴市场主要还是依靠源源不断的新客户。
4.3 用户指标
将 baby_birthday 与 trade_history 表联结
前面提到婴儿生日性别表里有
gender为 2 的数据,此处将其剔除,选用剔除之后的婴儿生日性别表baby_birthday
4.3.1 用户性别对比
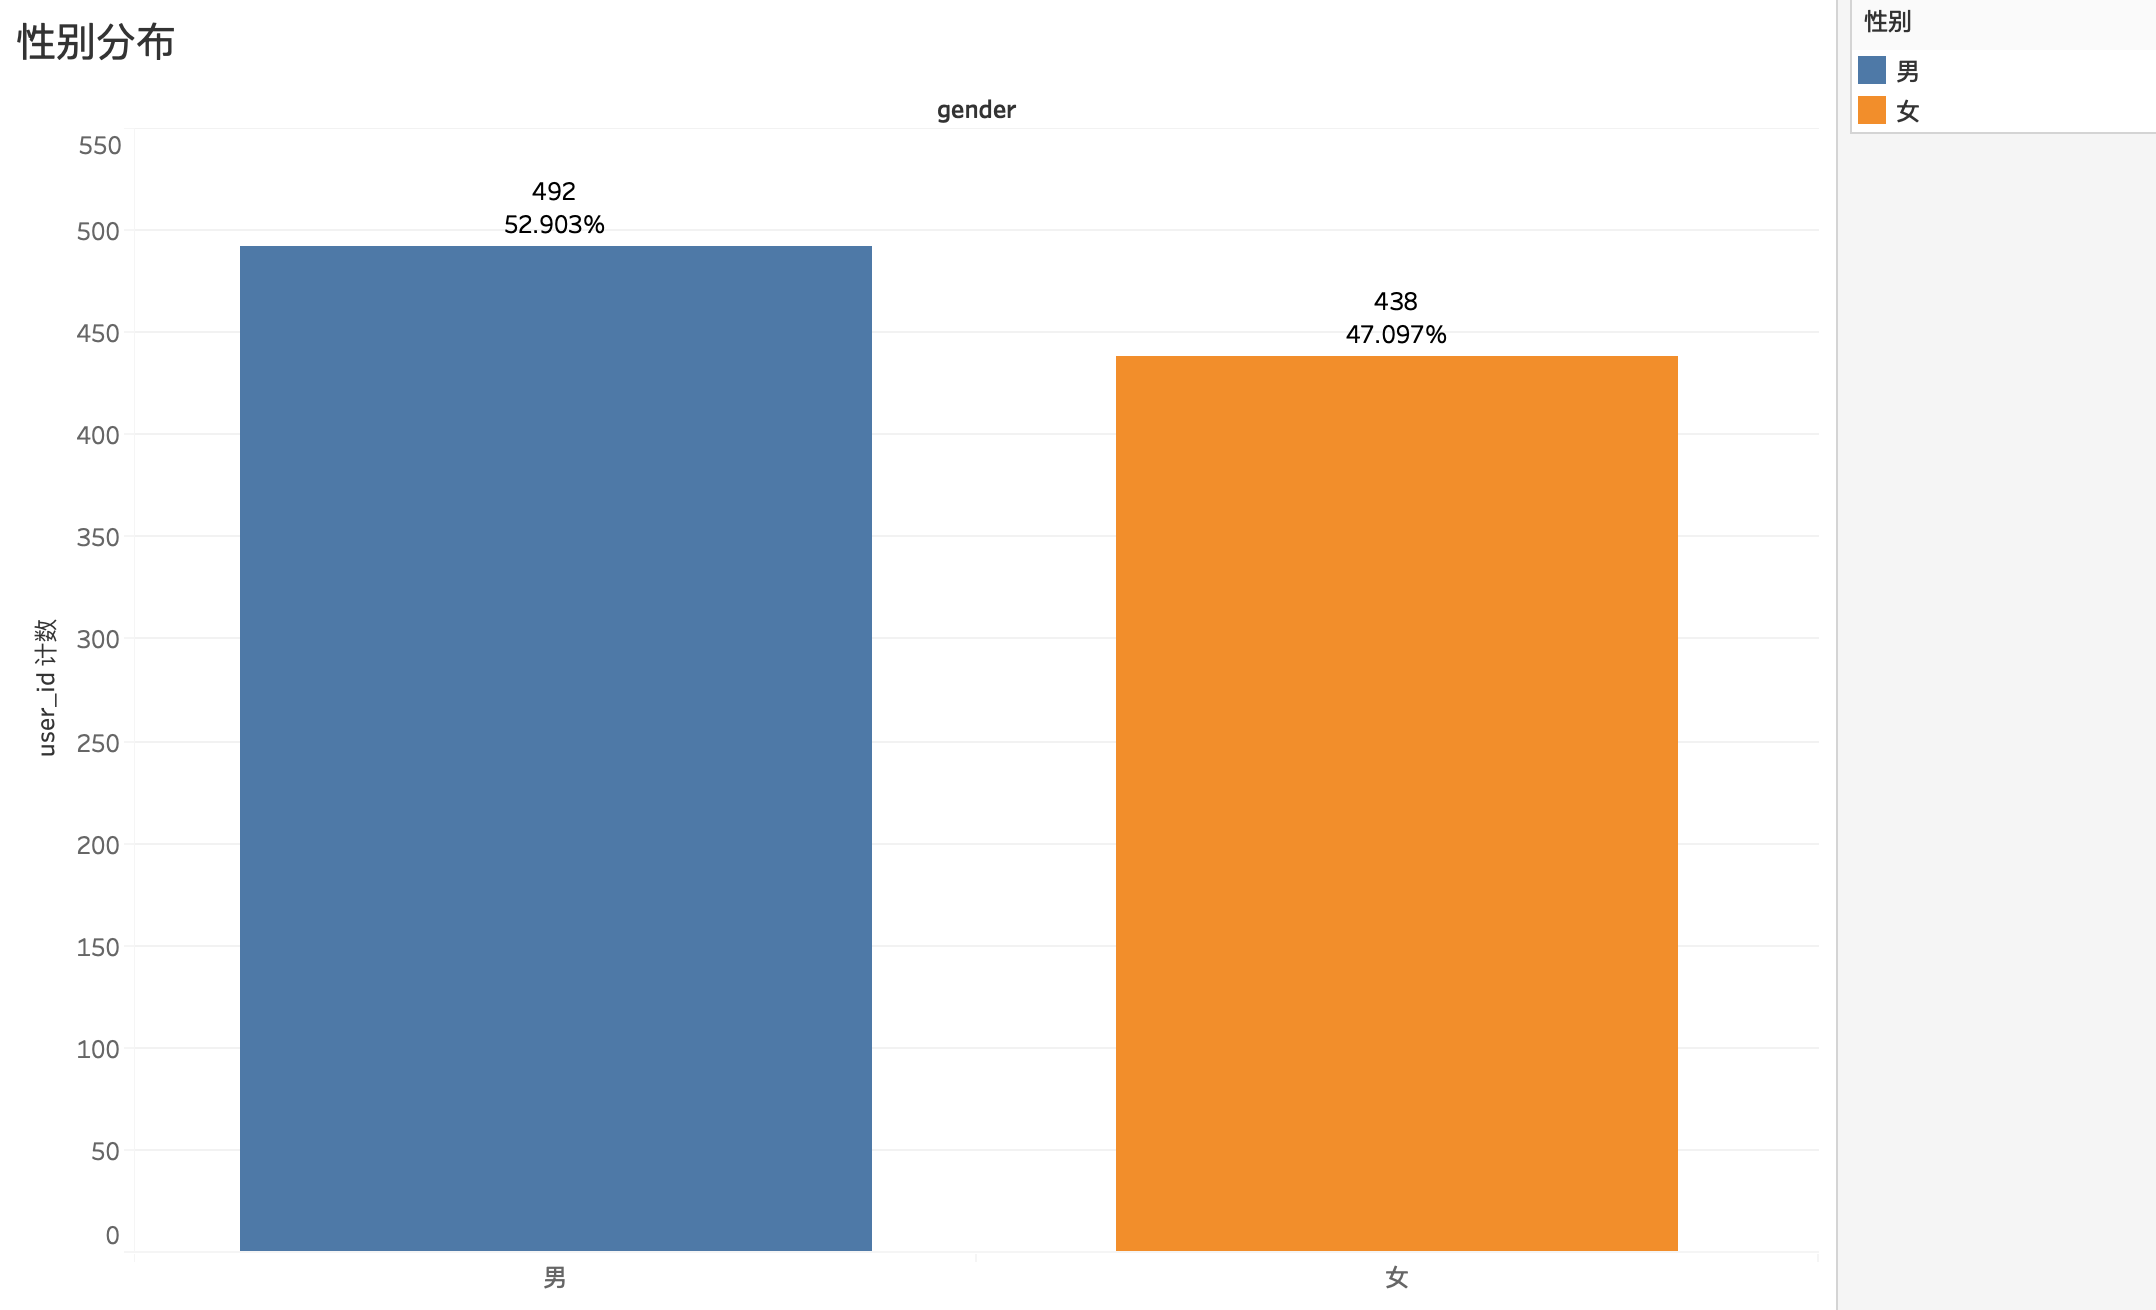
930个用户中,男女比例差距很小,男生比例只比女生多6%
4.3.2 目标用户年龄段
将用户根据年龄分成6个阶段,在Tableau里新建度量命名 年龄段:
IF (DATEDIFF('year',[birthday],[day])) >= 6 THEN '学龄期'
ELSEIF (DATEDIFF('year',[birthday],[day])) >= 3  THEN '学龄前期'
ELSEIF (DATEDIFF('year',[birthday],[day])) >= 1  THEN '幼儿期'
ELSEIF (DATEDIFF('year',[birthday],[day])) >= 0  THEN '婴儿期'
ELSEIF (DATEDIFF('month',[birthday],[day])) >= -10 THEN '胎儿期'
ELSE '备孕期'
END
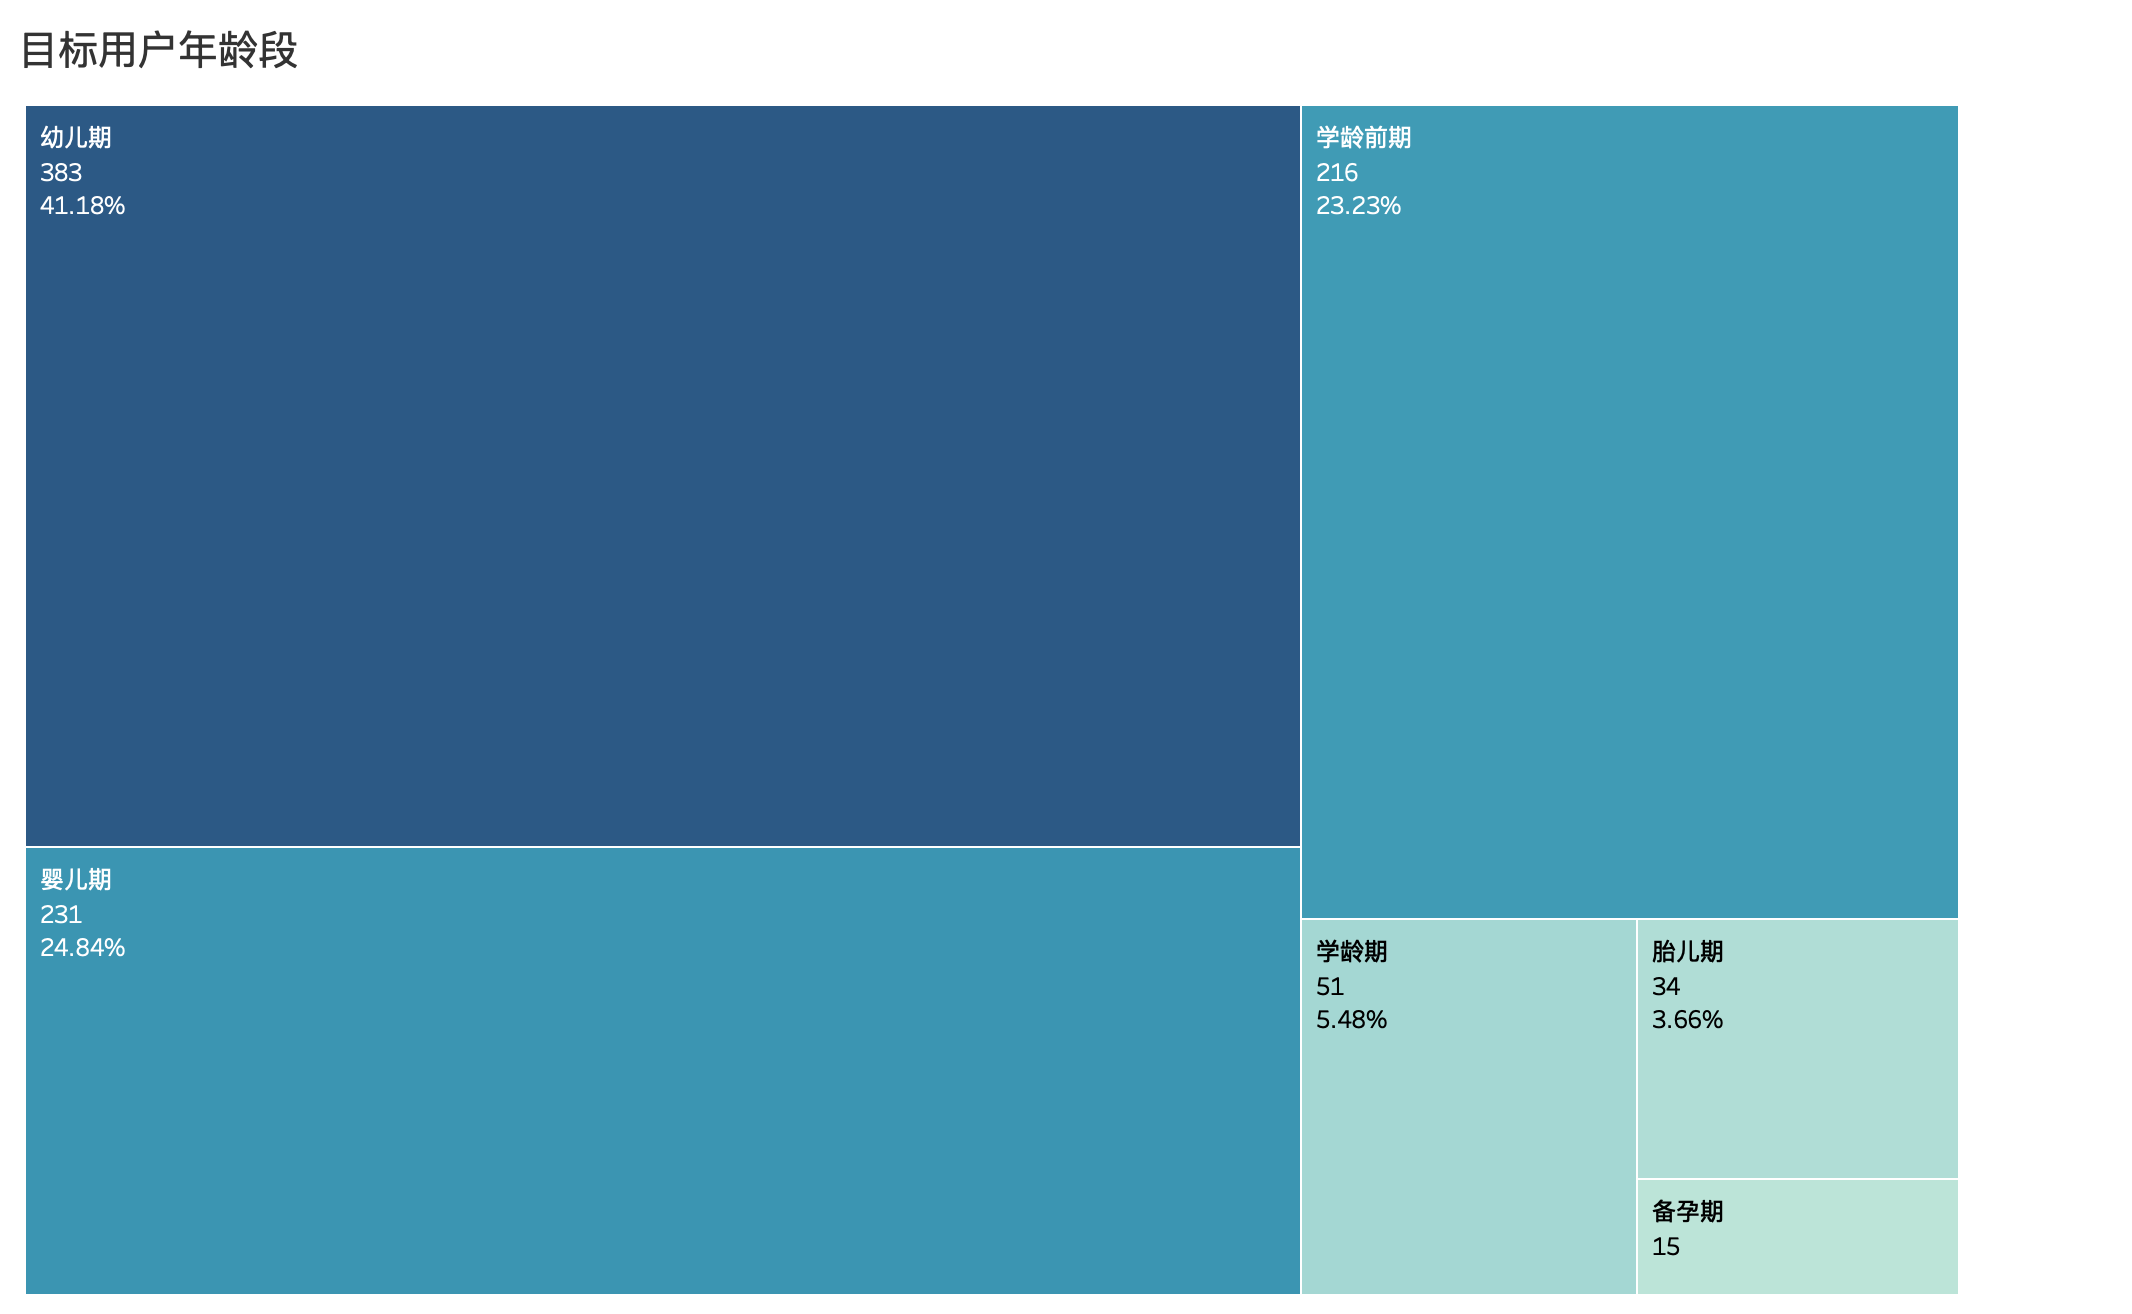
可以看出婴儿期和幼儿期,既0-3岁的宝宝是母婴市场占比最大的用户群。有一部分客户在婴儿未出生就开始准备母婴用品,3岁之后需求量开始下降。
4.4 商品类指标
4.4.1 商品特征
添加新自定义SQL,提取每个商品大类对应商品子类数量,
SELECT
    cat1 '商品大类',
    COUNT(distinct cat_id) '子类数量'
FROM
    trade_history
GROUP BY
    cat1
添加自定义SQL,提取商品大类对应订单量
SELECT
    cat1 '商品大类',
    COUNT(cat1) '大类订单量'
FROM
    trade_history
GROUP BY
    cat1
为了获取每个商品大类下子类的订单量,需要再添加 trade——history,将他们联结
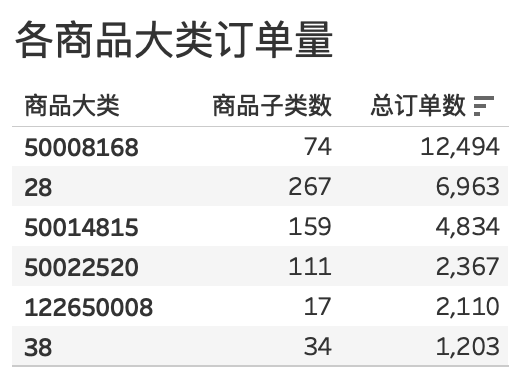
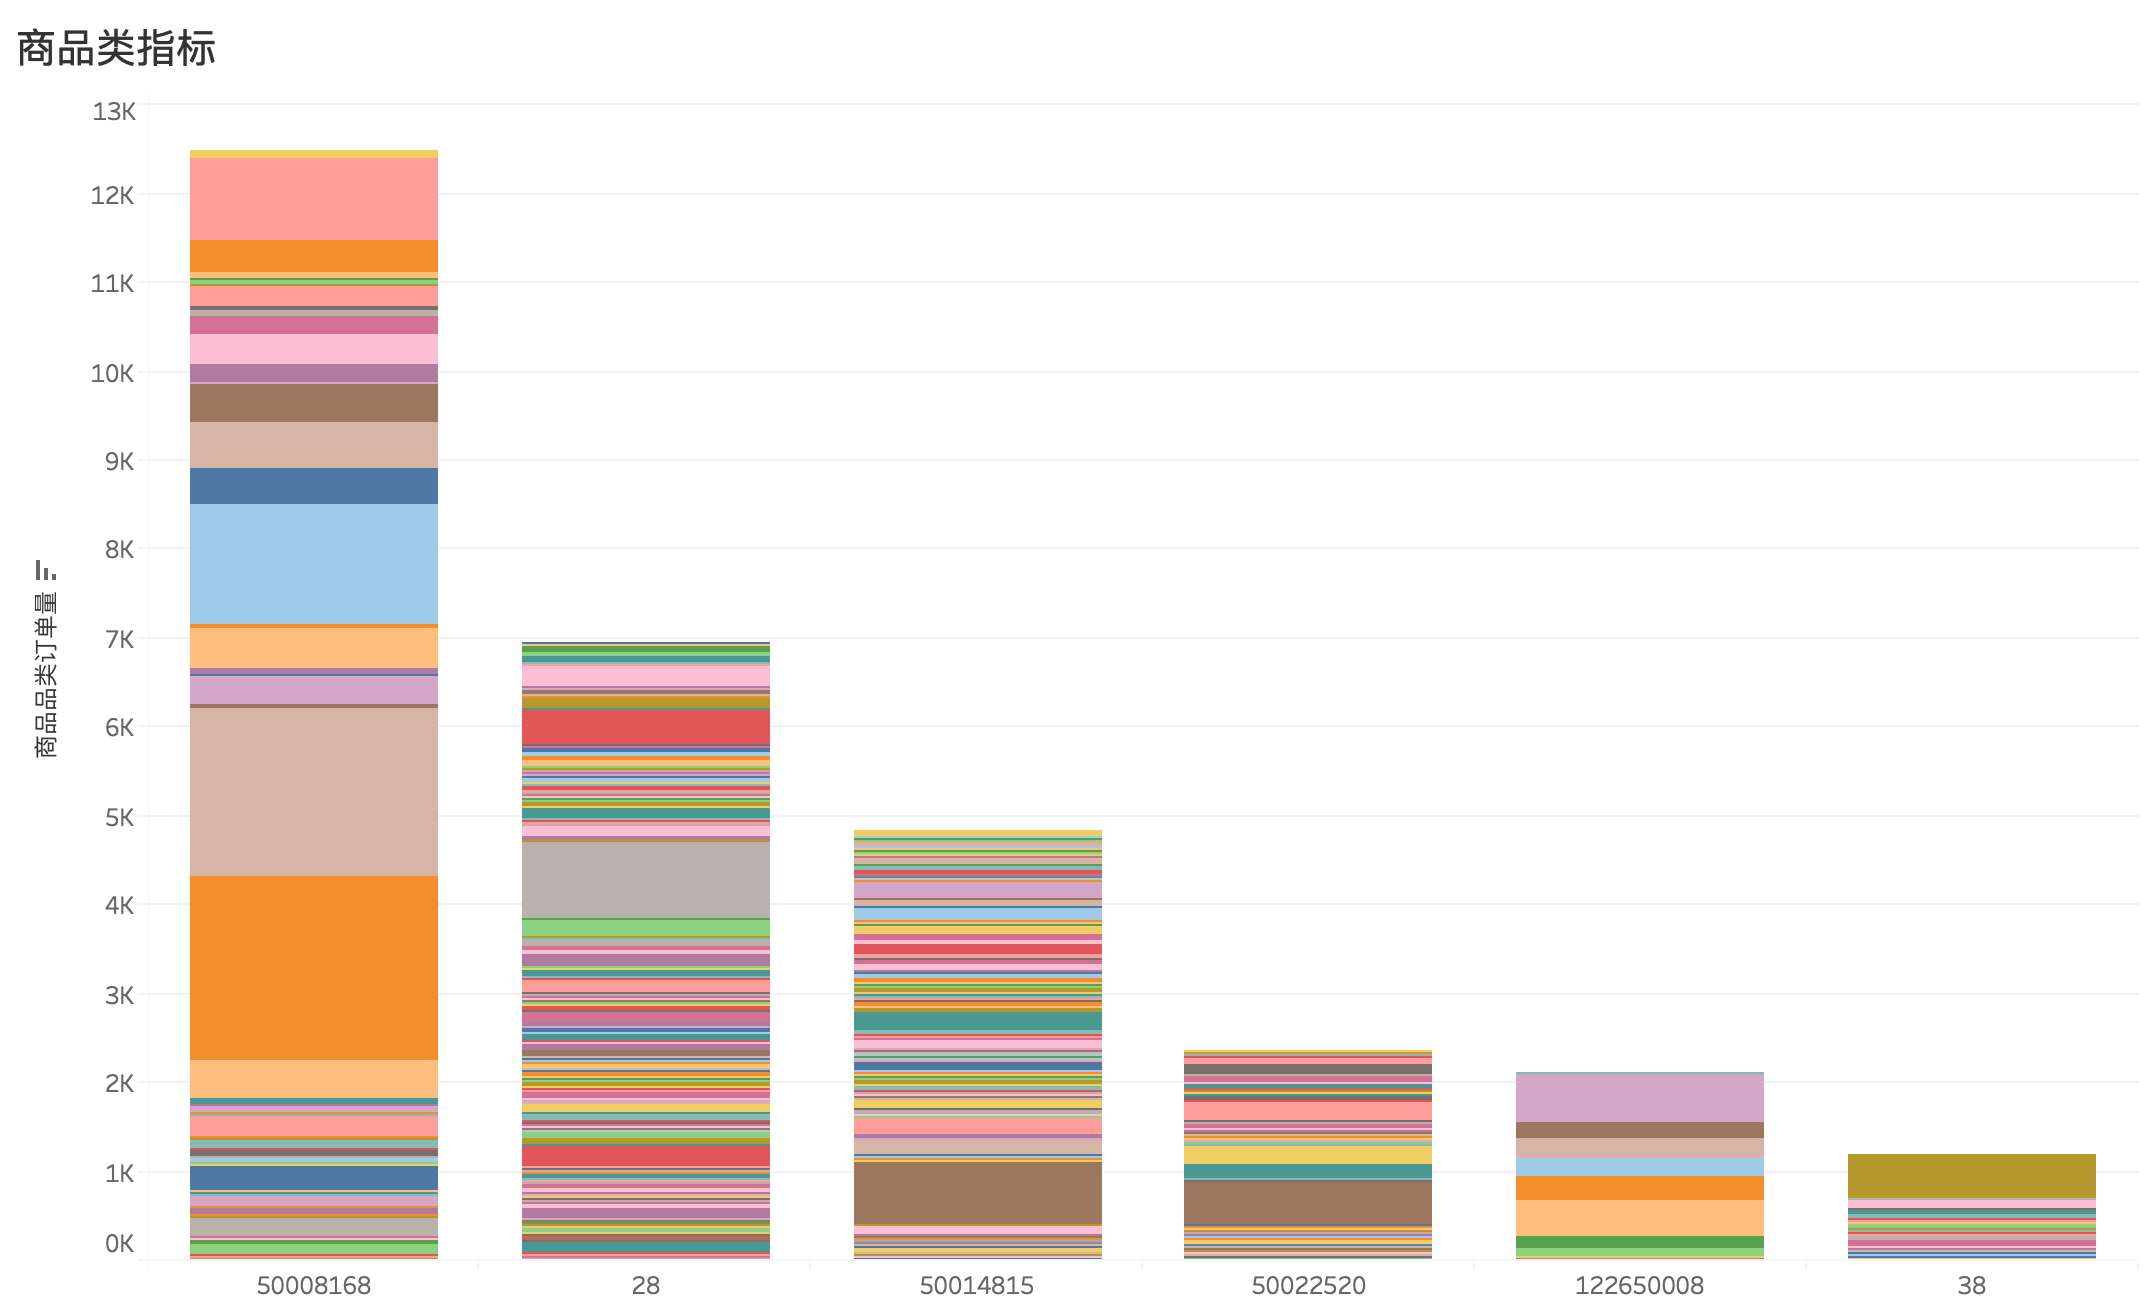
根据上表数据和条形图,可以发现商品特征如下:
- 销量最好,产品种类一般:
5008168 - 销量一般,产品种类丰富:
28、50014815 - 销量较低,产品种类丰富:
50022520 - 销量极低,产品种类较少:
122650008、38
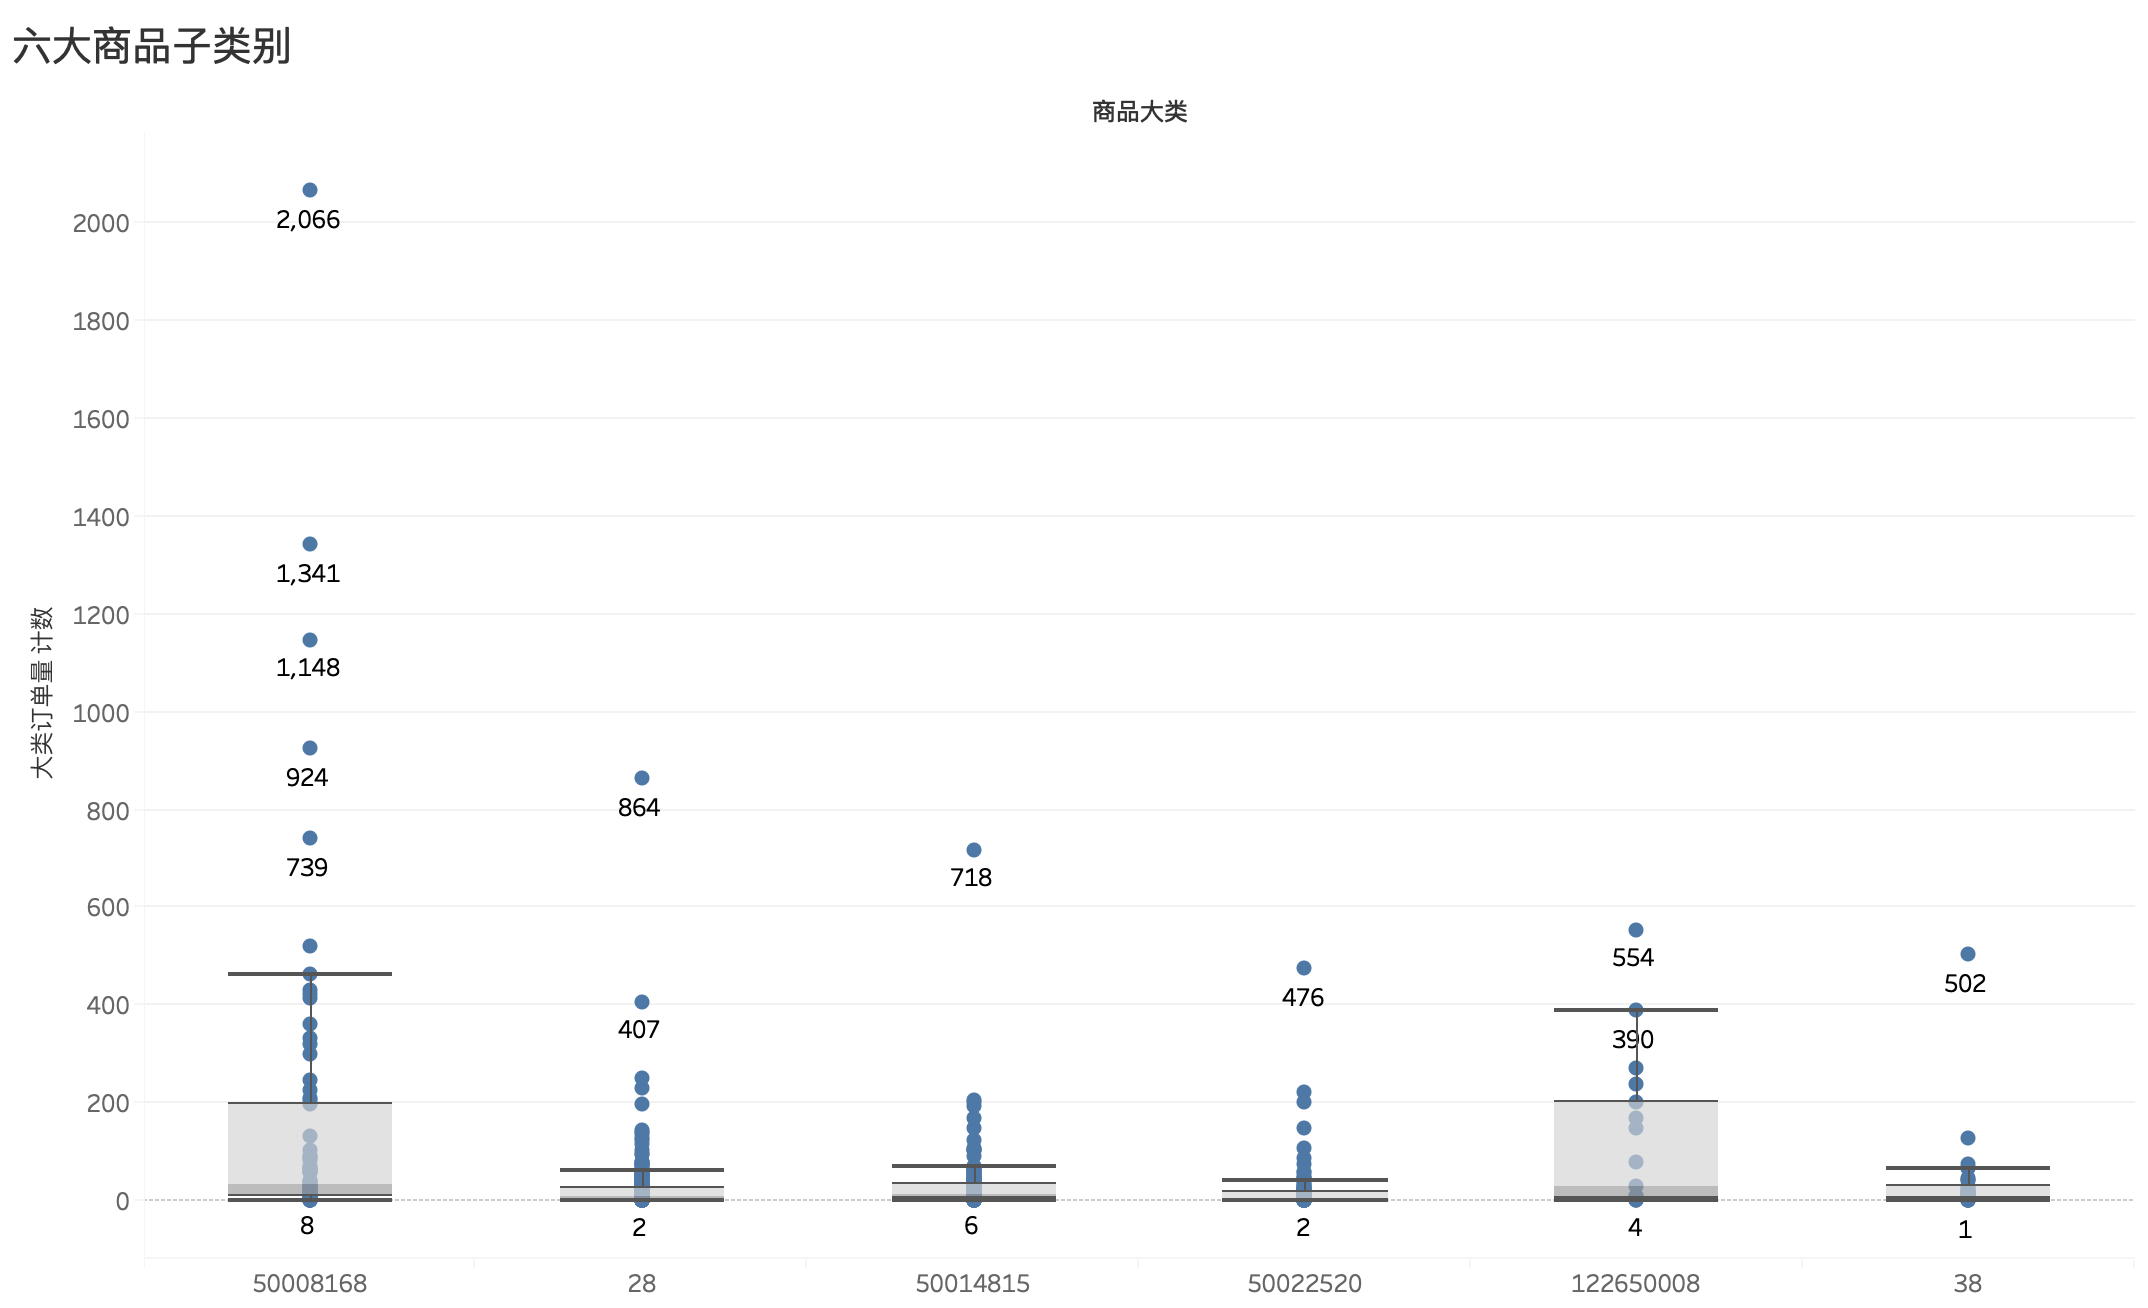
根据上面各类商品及子类订单量条形图绘制的箱线图,以此箱线图可知:
- 商品大类
5008168的中位数仅为33,但由于6款爆款产品以及销量大部分高于中位数的商品,使得5008168的总体销量位居第一 - 商品大类
28的中位数更低,仅为8,且聚集度高,说明大量的产品销量不好,使得该类产品总体单量表现一般 - 商品大类
50014815中位数为12,情况与28类似。 - 商品大类
50022520中位数为5,且聚集度高,且无表现突出产品,但因种类繁多,总体单量变现不至于最差 - 商品大类
122650008中位数为30,上四分位达到203,超过总体销量排名第一的5008168,可以看出前25%得商品在婴幼儿市场中的受欢迎程度很高,但因产品种类少,虽然总体单量表现不佳 - 商品大类
122650008中位数仅为9,且聚集度高,而且产品种类少,其中单子类211122达到该类别总量的41.73%
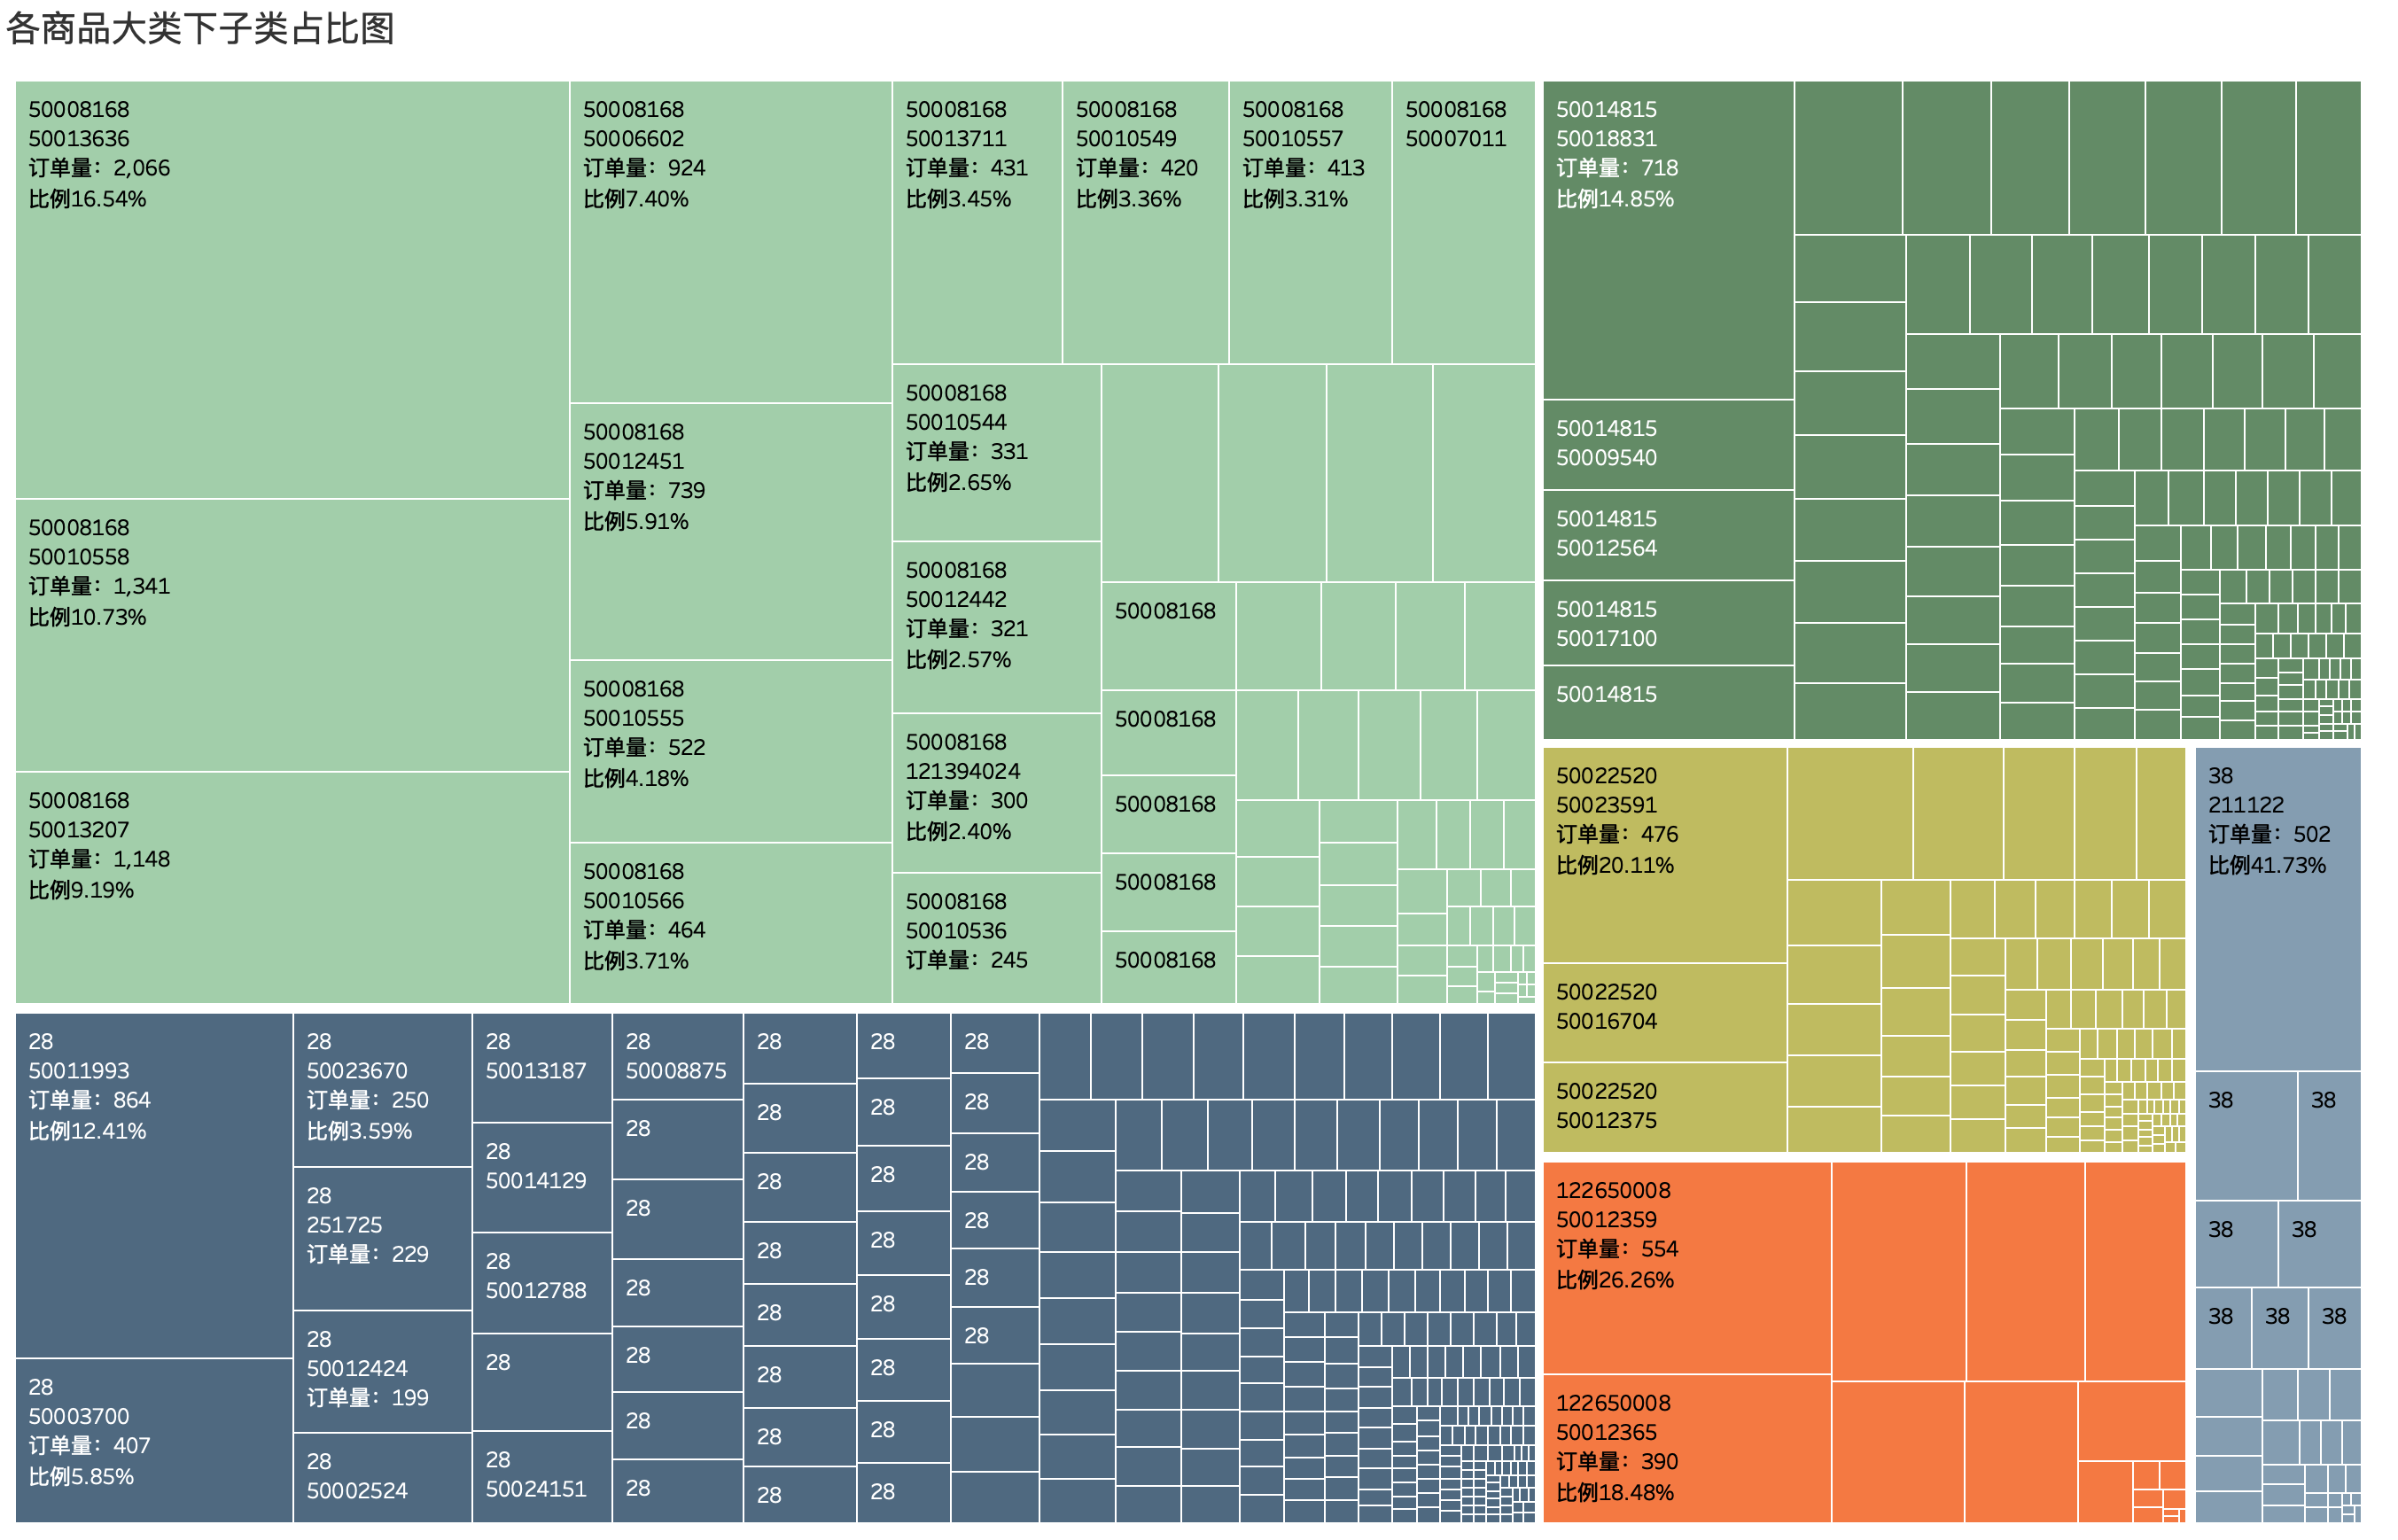
4.4.2 最受欢迎的商品
根据各个商品大类,分别选出最受欢迎产品,可以通过树状图展示
5 总结
- 互联网时代大背景下,电商平台为人们购物选择提供了极大便利,技术进步为产品的更迭创新提供支撑,优生优育的观念之下,母婴产品的需求变得大且广,仅2014年对比2013年,订单量即完成了50%以上的增长
- 每年10-12月为母婴行业的旺季,购物节(双十一、双十二)尤为火爆,卖家需要针对这段时间指定相应的活动方案,并且提前预热宣传,提升店铺曝光量,吸纳更多新客户
- 在长达两年半的时间段内,仅有回购客户占比不足0.1%,说明母婴行业内客户粘性非常低,针对这一现象,可进行两方面准备:其一,通过一些手段,诸如会员制、积分制、累积购物优惠、分享或邀请有礼等方式是新客户变成老客户,突破二次消费;其二,服从客观规律,加大曝光率,吸引更多的新客户
- 0-3岁的宝宝是母婴市场占比最大的用户群,增加在这个客户群体对应产品的开发,进一步提升客户消费量
- 每种品类里都有爆款产品,销售量都远比同类其他产品高,可以尝试多打造爆款,提升整个品类的销量。
『此文复现 https://zhuanlan.zhihu.com/p/68105677 侵删』
]]>